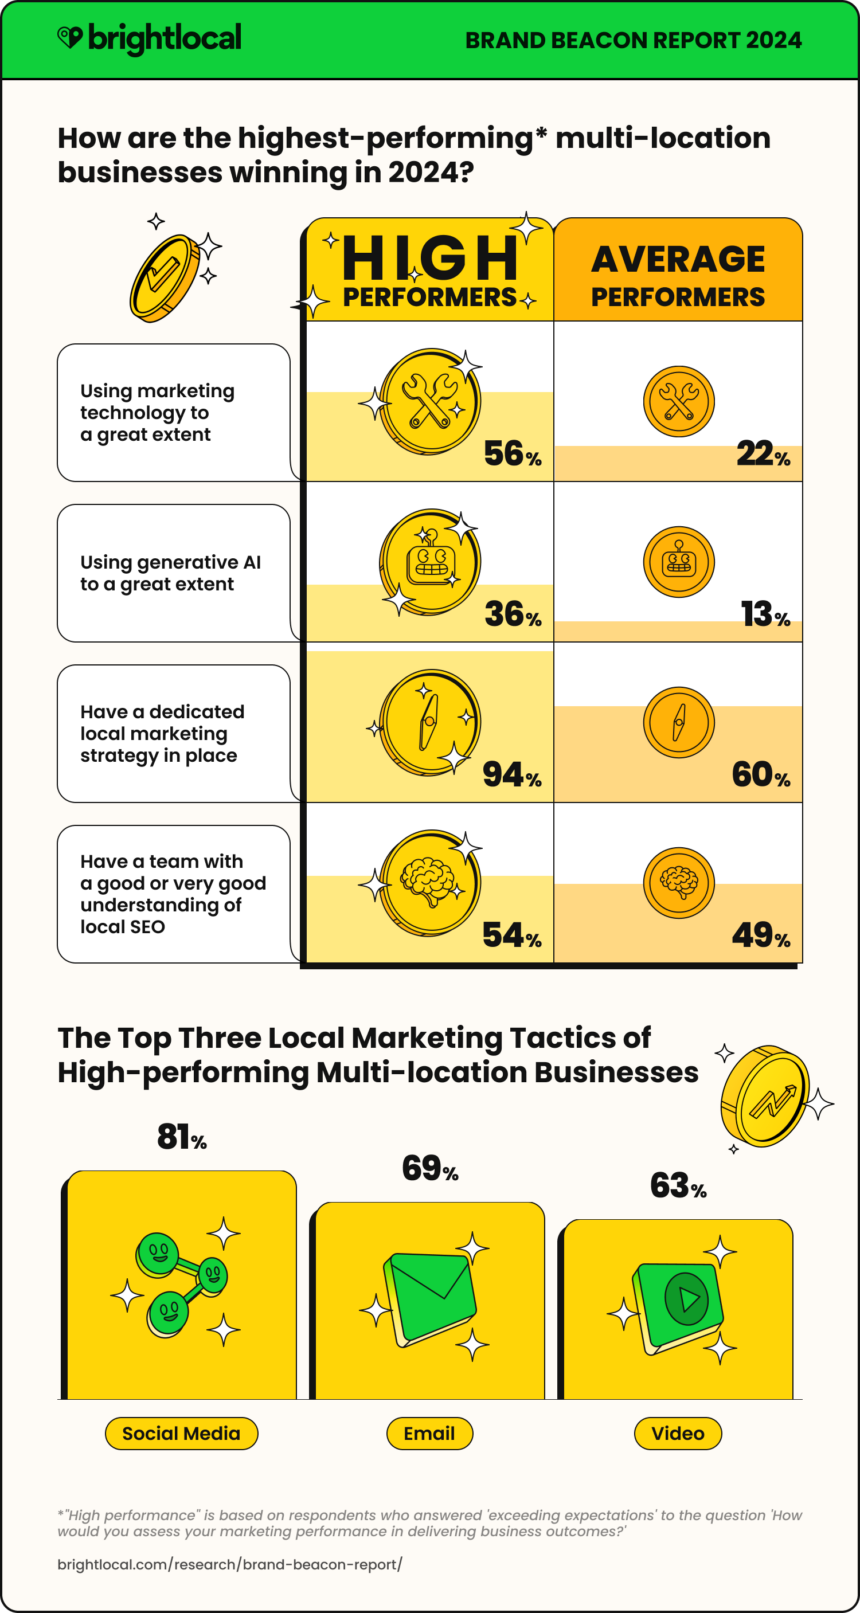
- 94% of high-performing brands have a dedicated local marketing strategy, compared to 60% of average performing brands.
- High-performing brands are 15% more likely to focus on customer retention and customer satisfaction than average-performing brands.
- 88% of multi-location marketers are already using generative AI within their organizations.
- 77% of multi-location brands feel optimistic about economic conditions in 2024.
- 81% of multi-location businesses are likely to open new locations in 2024.
- Social media, email marketing, paid advertising and video are the top local marketing tactics used across all business sizes.
It’s no secret that brick-and-mortar businesses have had it rough in recent years. Rapid changes in public health and safety, economic turmoil, and political disruption have affected the world, causing significant shifts in consumer behavior.
While much of the physical economy has recovered since the pandemic, there is evidence that it caused a sharp disruption in brand loyalty. Purchase decisions fueled by convenience, value, and proximity have led to new shopping behaviors.
Of course, businesses in every sector will face unique challenges. But only multi-location marketers will know the ongoing chess game of managing a brand at local, regional, and national levels.
We wanted to understand the challenges multi-location businesses face in 2024, how they might differ based on their size, and what drives marketing performance.
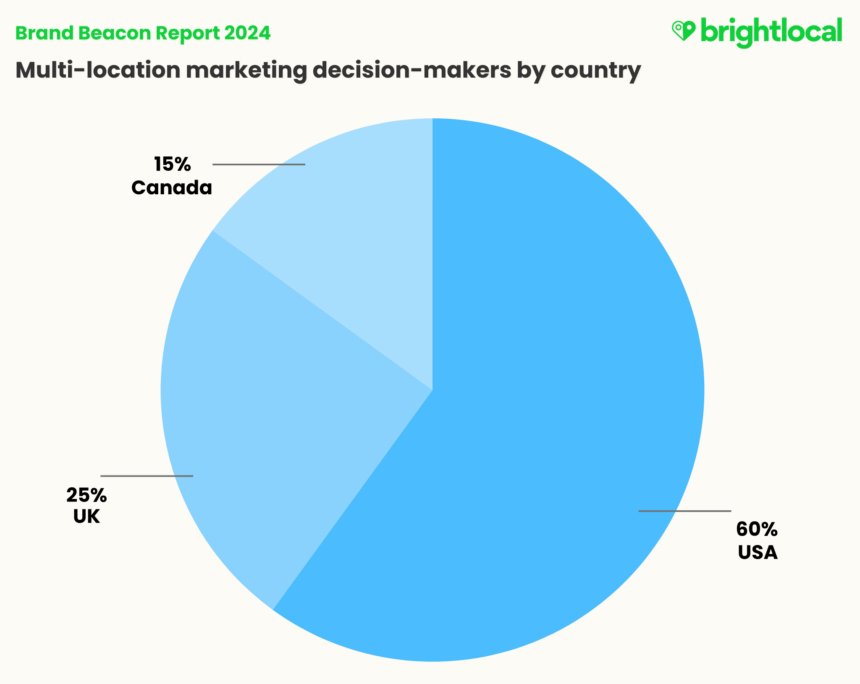
To achieve this, we asked 200 marketing decision-makers working in multi-location brands in the USA, Canada, and the UK about their marketing performance, investments, and strategies to build a picture of the current multi-location landscape and understand the key to high performance in 2024.
Throughout the report, we’ll discuss critical themes of marketing technology, the importance of customer satisfaction and retention, and areas of opportunity in marketing tactics.
The Key to High Performance in Local Marketing
As we’ll learn in this report, the most successful businesses:
- Have dedicated local SEO strategies
- Have teams that understand the difference between traditional and local SEO
- Are using marketing technology to support their local marketing
- Prioritize improving customer retention and satisfaction
- Invest highly in social media
Understanding Definitions Within the Report
In the second part of this report, we’ll talk about the ‘High Performers’ of multi-location marketing, creating a benchmark that we’ll refer to throughout. Readers will find this helpful in measuring their performance and that of competitors.
The third section of this research will highlight three key groups: Local Players (11-50 locations), Regional Challengers (51-100 locations), and Big Brands (101+ locations) and compare what they’re doing to the High Performers, so businesses of all sizes have a benchmark to look to.
| TERM | DEFINITION |
|---|---|
| High Performers | Brands who said their marketing performance ‘exceeded’ expectations in 2023 |
| Average Performers | Brands who said their marketing performance ‘met’ or ‘fell short’ of expectations in 2023 |
| Big Brands | Brands with 101+ locations |
| Regional Challengers | Brands with 51-100 locations |
| Local Players | Brands with 11-50 locations |
The Multi-location Marketing Landscape: Key Trends
Let’s kick off with an overview of the market in general. We’ll look at how brand marketers feel they’ve been performing, what channels they’re investing in, and what local marketing looks like for them.
Looking Back: Marketing Performance in 2023
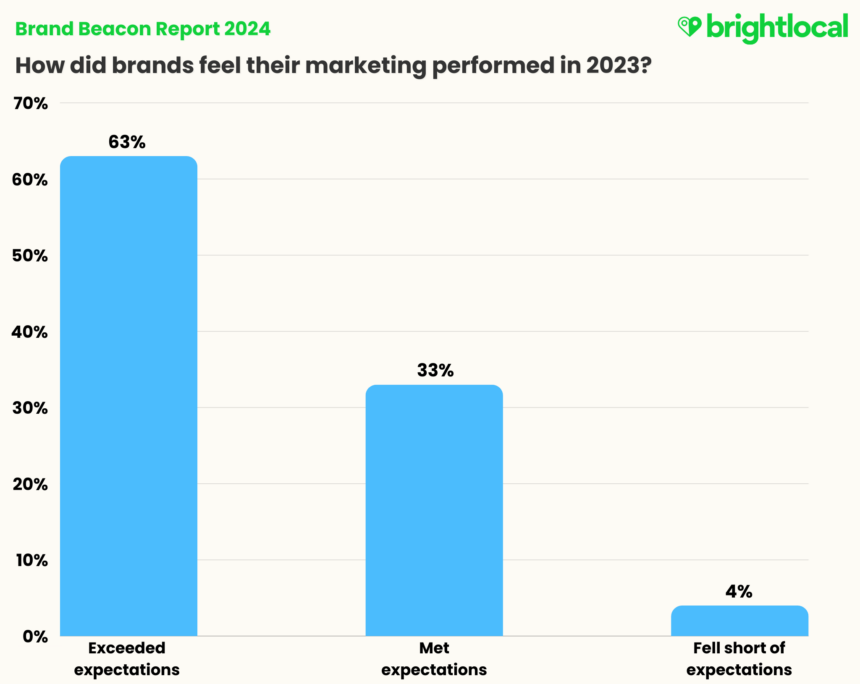
The great news is just 4% of multi-location marketers feel their marketing performance fell below expectations in 2023. With almost two-thirds reporting that performance exceeded expectations, it’s a highly positive perception of their teams’ capabilities.
The Marketing Mix
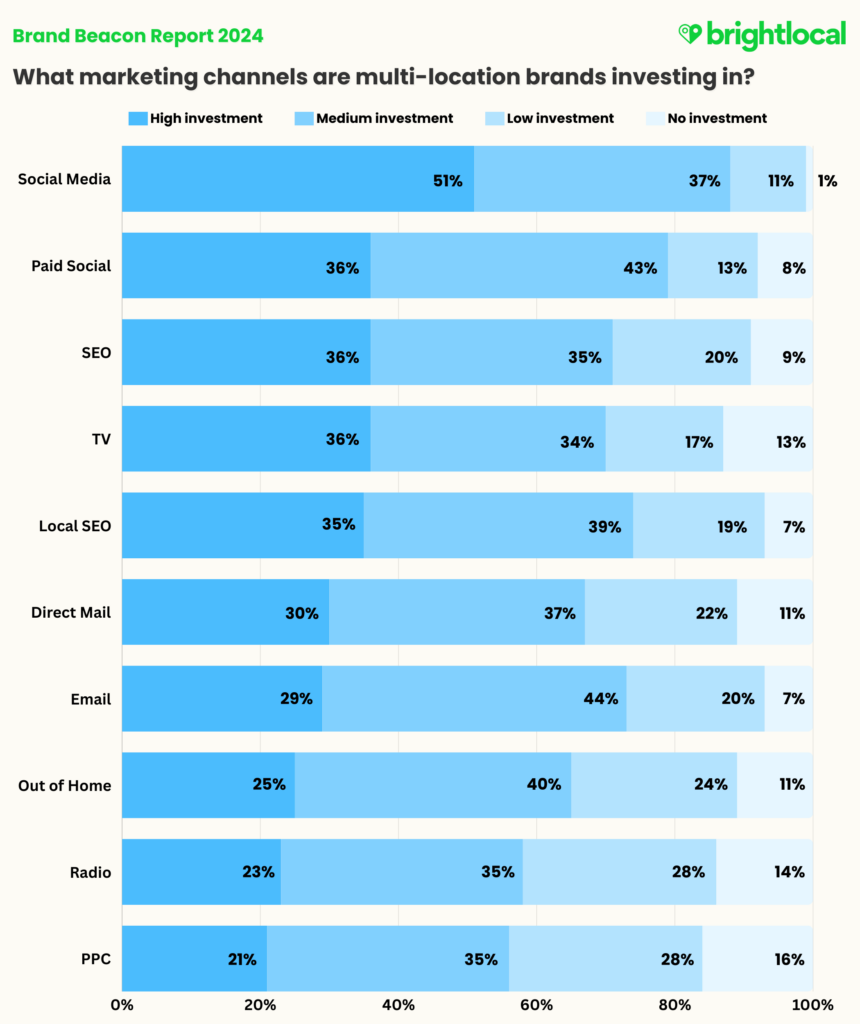
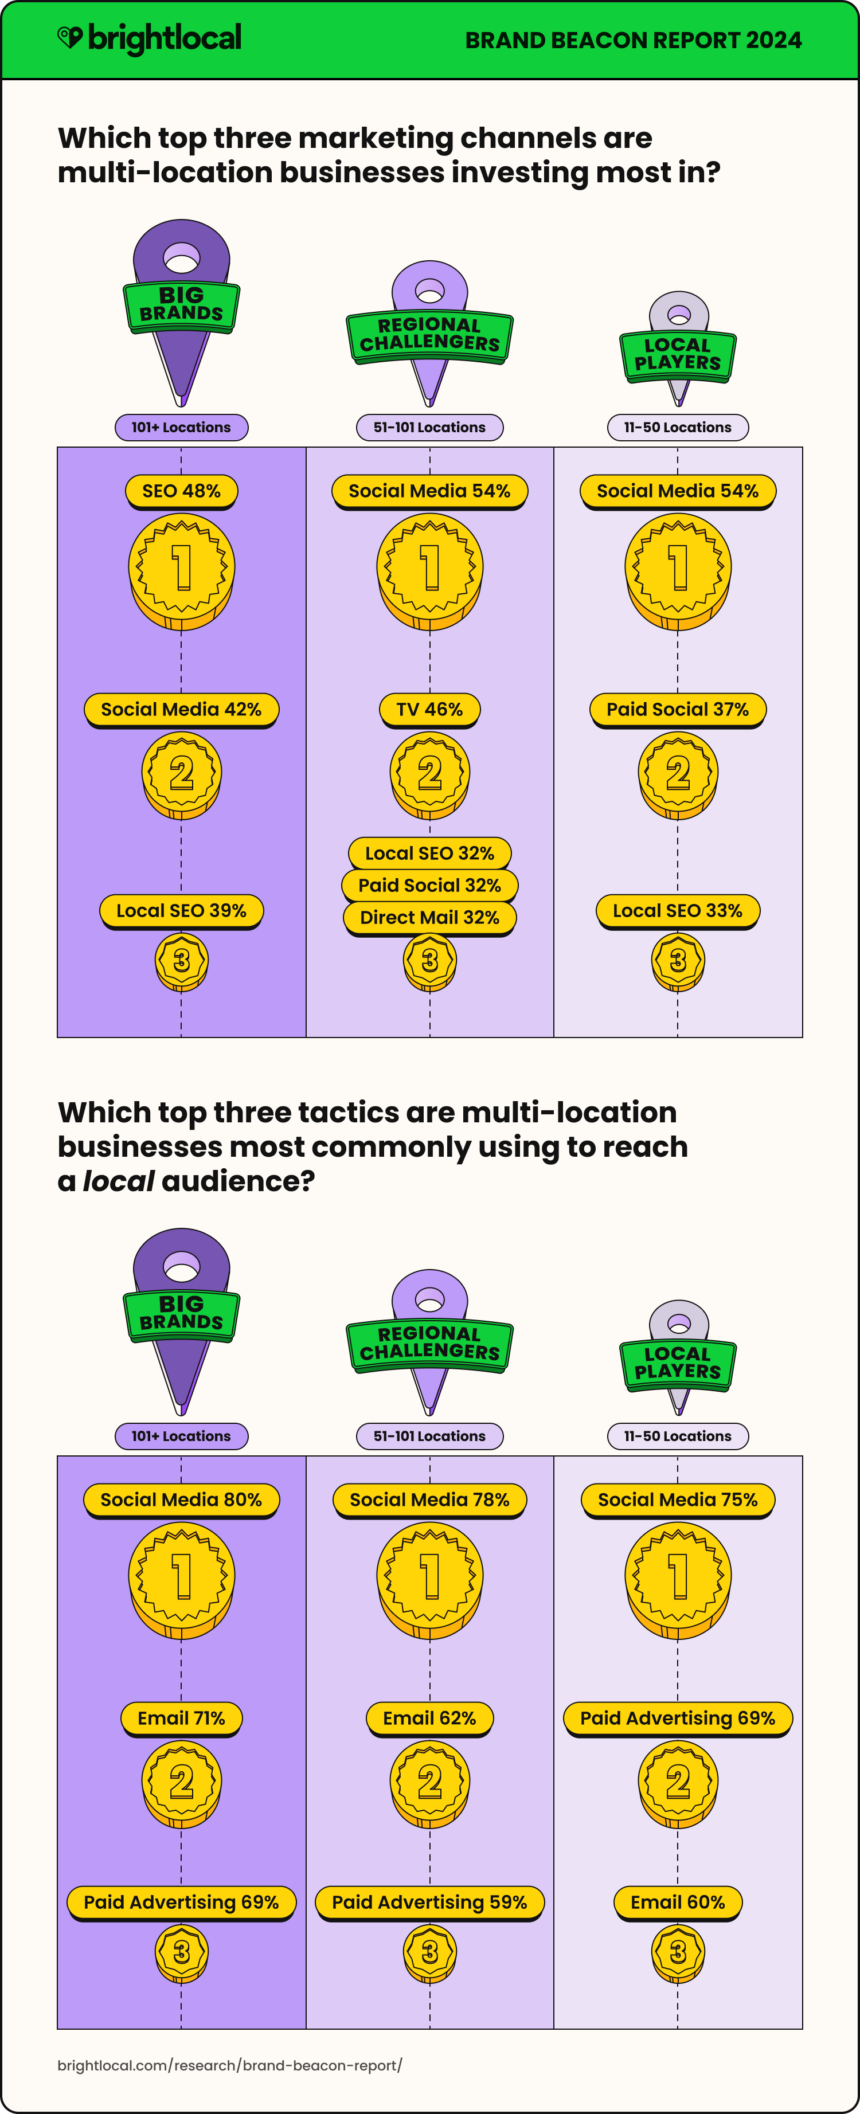
The Top Five Channels That Multi-location Brands Are Investing In
| 1. Social Media | 51% |
| 2=Paid Social | 36% |
| 2=SEO | 36% |
| 2=TV | 36% |
| 5. Local SEO | 35% |
A whopping 99% of multi-location brands are investing in social media, with 88% investing a medium-high amount in this channel. This result is significantly higher than the other marketing channels listed, so it’s clear that social media forms a vital part of multi-location marketing strategies.
Paid social, SEO, TV advertising, and local SEO follow as the next most invested in marketing channels. So, brands are investing in brand awareness channels (Paid social and TV) while also focusing on the importance of visibility (SEO and local SEO).
It’s interesting, then, that PPC is at the bottom of the list for channel investment. Sitting lower than traditional forms of marketing (direct marketing, radio, out-of-home advertising), this could suggest that brands do not see the best returns from PPC for brand awareness. Alternatively, it could just be that multi-location brands use PPC for smaller or more targeted strategies and are getting more from their campaigns for lower spend.
Marketing Team Capabilities
As mentioned earlier, multi-location brands will face different challenges than other business types. Consistency is a big theme here, as brands must replicate the same standards, service, and experience they are known for from location to location.
Another challenge is maintaining brand standards when adapting to new areas where local requirements and customs may differ.
We wanted to gauge how marketers felt their businesses were doing in keeping on top of these common obstacles.
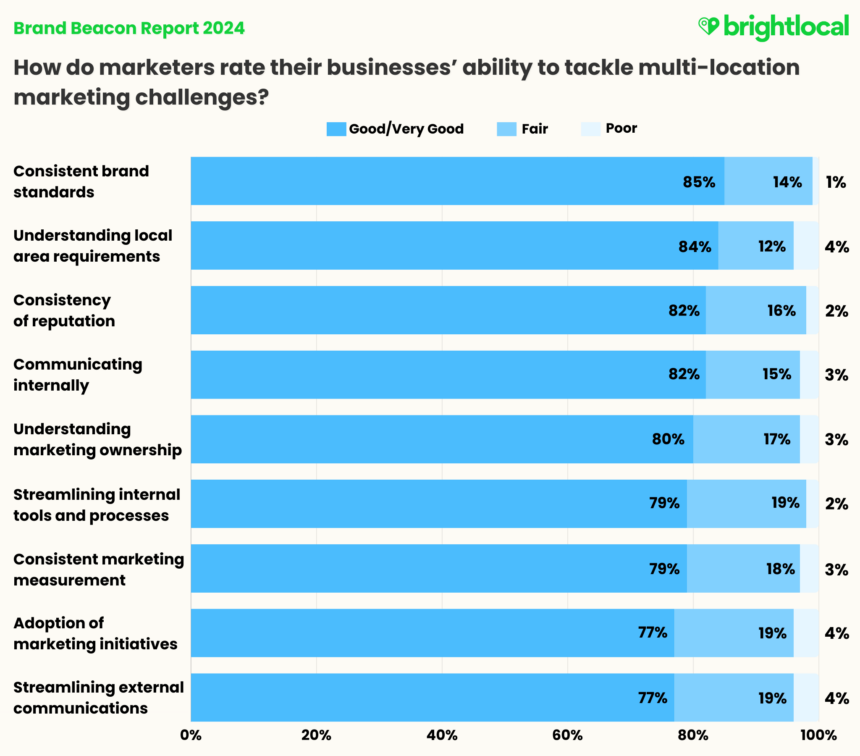
The Top Five Business Challenges That Multi-location Marketing Teams are ‘Very Good’ or ‘Good’ at Tackling
| Consistent brand standards | 85% |
| Understanding local area requirements | 84% |
| Consistency of reputation | 82% |
| Communicating internally | 82% |
| Understanding marketing ownership | 80% |
As with performance, marketing leaders generally reflect a positive sentiment towards their teams’ capabilities, and there don’t appear to be any glaring problem areas.
However, while 80% of brands said their businesses were either ‘Very Good’ or ‘Good’ at understanding ownership of marketing within organizations, we can see that 23% felt that the ability to manage the adoption of marketing initiatives and streamline external communications was just ‘Fair’ to ‘Poor’. This suggests a potential breakdown between the communication and execution of some marketing as responsibilities fall to location levels.
It could also show that, although 82% of our marketing decision-makers feel their organizations are ‘Very Good’ or ‘Good’ at managing internal communications, the messages might not be being received or understood as well as they think further down the chain.
Let’s take a look at where local marketing strategy comes into play.
Local Marketing as a Strategy (Not Just a Tactic)
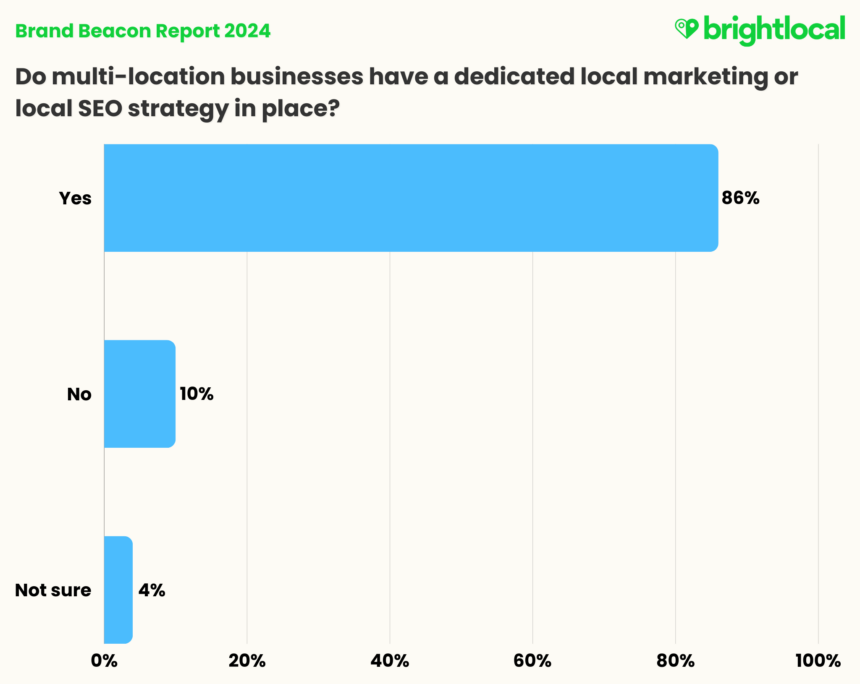
It’s positive to see that the vast majority (86%) of multi-location brands have dedicated local marketing strategies in place. That leaves 14% where either no dedicated strategy exists or the strategy is unclear
A lack of dedicated local strategy means that crucial business challenges, such as the ones mentioned above, can be much harder to overcome. With no local marketing strategy, how can you expect teams in different regions or locations to fully understand, be on board with, and adopt marketing initiatives?
So, if you’re reading this, you don’t have a robust local strategy, and you’re familiar with some of these marketing challenges, local strategy might be an excellent place to start.
Managing Local Marketing Activities
Now, the way multi-location businesses execute marketing activity at regional or local levels may vary for many reasons, based on industry, differences in area requirements, or franchising requirements. It’s interesting to look broadly at how multi-location brands manage this, though.
Again, if there are gaps in how well your business manages multi-location challenges, considering the different approaches may help you understand why.
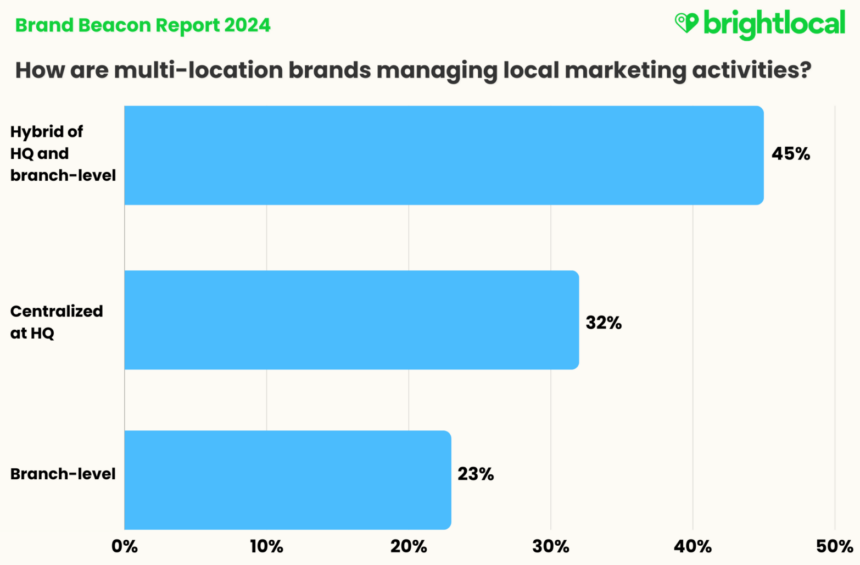
Almost half (45%) of multi-location brands use a hybrid approach of centralized marketing teams (at the level of HQ) and branch or location-level local marketing.
What works for one business won’t necessarily work for another, and we’re not saying there is a correct answer. But it is worth considering that plenty of research around change management, business transformation, and product adoption shows that teams often react more positively to change, or are more willing to adopt new processes and initiatives if they feel they have some ownership of them.
Supporting Local Marketing with Technology
Next, we wanted to understand how widely technology was used in multi-location local marketing. 98% of brand respondents say they are using the technology to support local strategies.
Of course, when we refer to marketing technology that supports local marketing, this could include any number of tools, from monitoring local rankings and fluctuations to business location performance data, review management, and more. But what this does tell us is just how crucial marketing technology is in delivering on these tactics.

Build a 5-star Reputation
Collect, monitor, and respond to reviews with ease
The ‘High Performers’ of Multi-location Marketing
In this section, we will take the brands who reported that their marketing performance ‘exceeded’ expectations and use this group to create the benchmark for marketing performance.
Throughout the report, we’ll refer to this group as ‘High Performers.’ The remaining brands we compare against—those meeting expectations or falling short—we’ll refer to as ‘Average Performers.’
It’s important to note that both groups contain respondents representing multi-location businesses of all sizes.
High Performers: Key Findings
Marketing Channel Investments
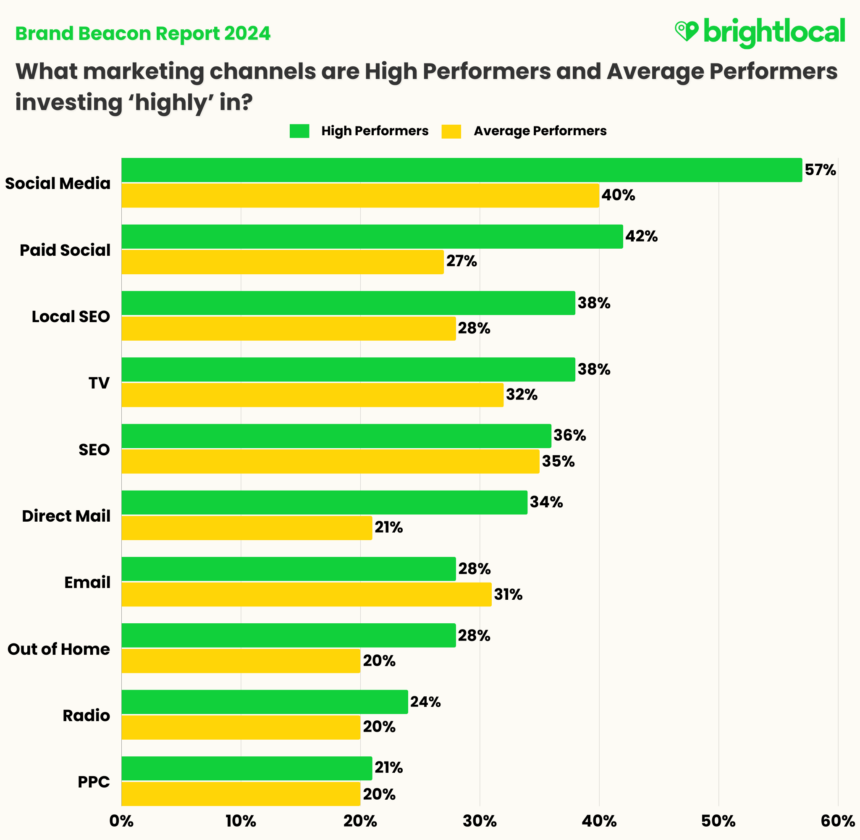
- High Performers are 17% more likely to invest ‘highly’ in social media than Average Performers (57% vs 40%).
- High Performers are 15% more likely to invest ‘highly’ in paid social than Average Performers (42% vs 27%).
High Performers are 10% more likely to invest ‘highly’ in local SEO than Average Performers (38% vs 28%).
Using Marketing Technology and AI
- 56% of High Performers are using marketing technology to ‘a great extent’, compared to 22% of Average Performers.
- 36% of High Performers are using generative AI to ‘a great extent’, compared to just 13% of Average Performers.
Local Marketing Strategy
- 94% of High Performers have a dedicated local marketing strategy, compared to 60% of Average Performers.
- 52% of Average Performers rate their marketing teams’ understanding of local SEO as ‘Fair’ to ‘Poor’, while 93% of High Performers rate their teams’ understanding as ‘Good’ or ‘Very Good’.
High Performers: Top Trends
Marketing Channel Investment
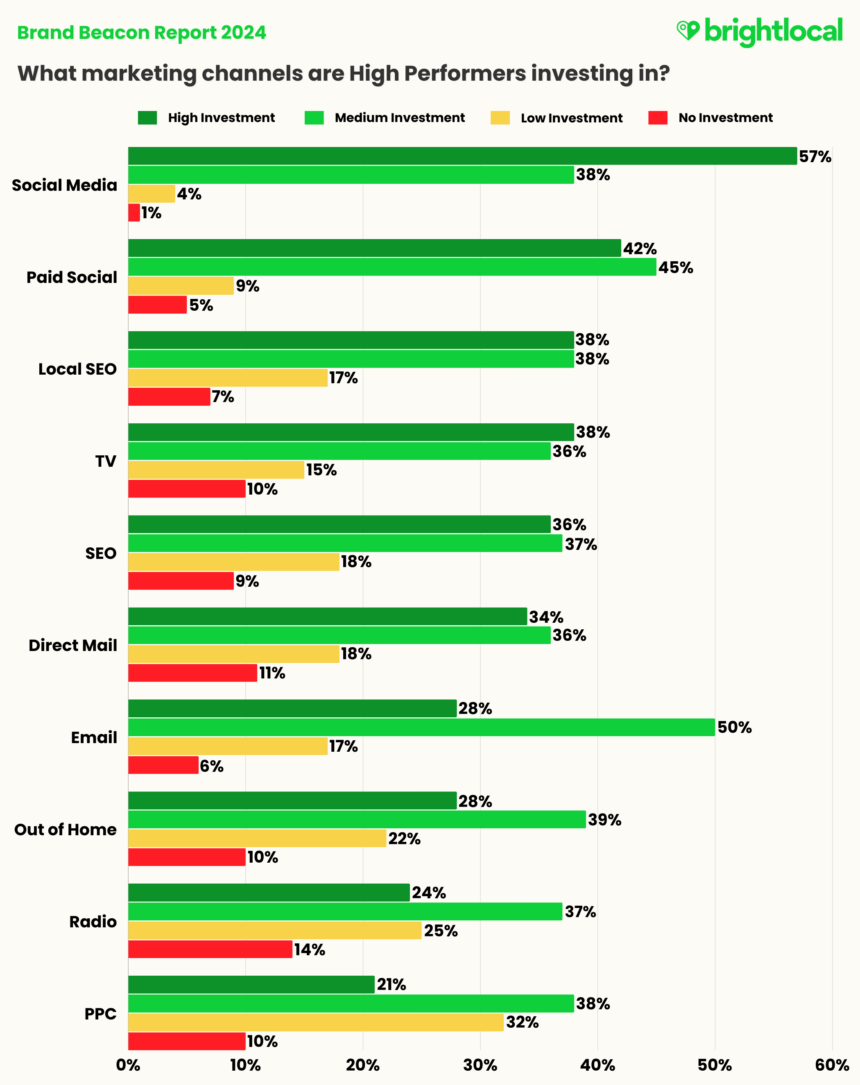
- 95% of High Performers are investing a medium-high amount in social media.
- Just 1% of High Performers do not invest in social media at all.
- After social media (organic and paid), High Performers are investing the most in Local SEO.
- Of the responses offered, the channel High Performers invest in the least is PPC (pay-per-click).
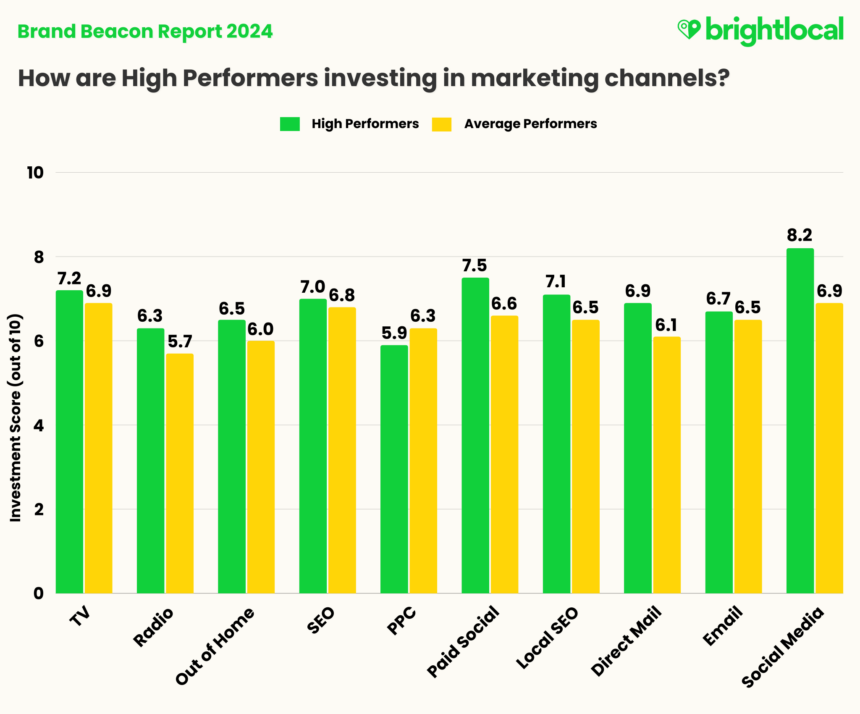
This chart highlights the investments High Performers make across their marketing mix. You’ll notice a lot of green bars, which shows that High Performers are no slouches when it comes to putting their hands in their pockets and investing in a variety of channels.
Organic social media stands out, with the most significant level of investment: 57% of High Performers rated their investments in the channel as ‘High.’ Just 1% said they do not invest in social media at all.
Behind organic social media, paid social sits as the second most invested in. Paid social is a popular choice for awareness and discovery campaigns to capture new audiences and entice customers away from competitors. These two channels being positioned at the top of the chart suggest that High Performers prioritize customer acquisition and retention equally.
Local SEO sees the third-highest level of investment from High Performers, with 76% making medium-high investments in this area.
As we’ll get into shortly, High Performers are much more likely than other businesses to have a dedicated local marketing or local SEO strategy in place, so it’s clear that a confident understanding and investment in this area is paying off for them, and that local marketing is fundamental to overall marketing success.
Pay-per-click advertising (PPC), meanwhile, is the least invested in. 10% of High Performers aren’t investing in the channel at all, while 32% have stated only a low level of investment.
Local Marketing Focus: Strategy, Knowledge, and Tools
While we asked multi-location marketers about their level of investment in local SEO, we also wanted to understand whether this is an area that marketers fully understand. Namely, whether businesses have dedicated local SEO strategies in place and whether their marketing teams clearly understand the differences between traditional SEO and local SEO.
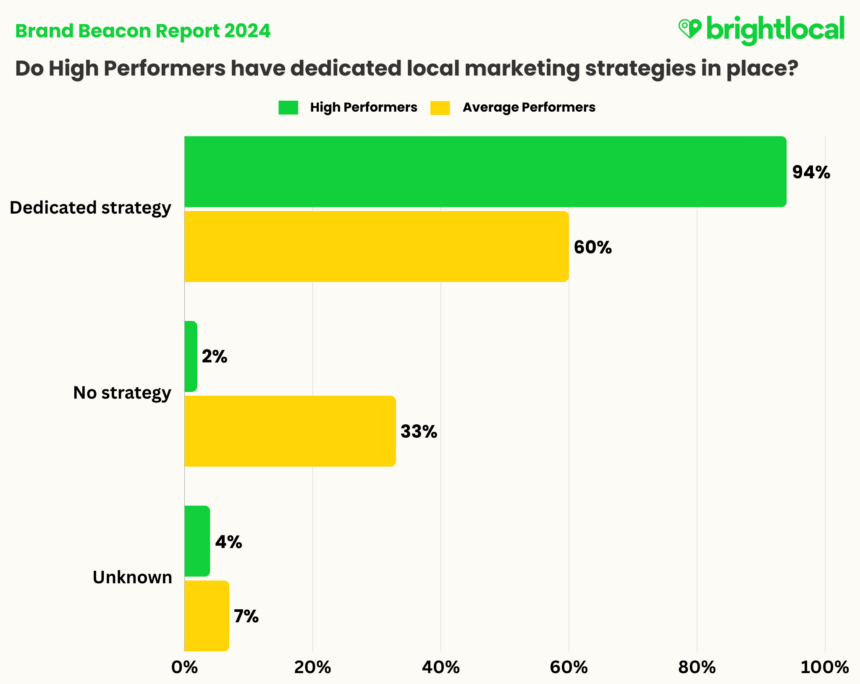
- 94% of High Performers have a dedicated local strategy in place—34% more than Average Performers
There is a clear contrast here, with just 2% of High Performers stating they don’t have a dedicated local strategy, compared to a third of Average Performers.
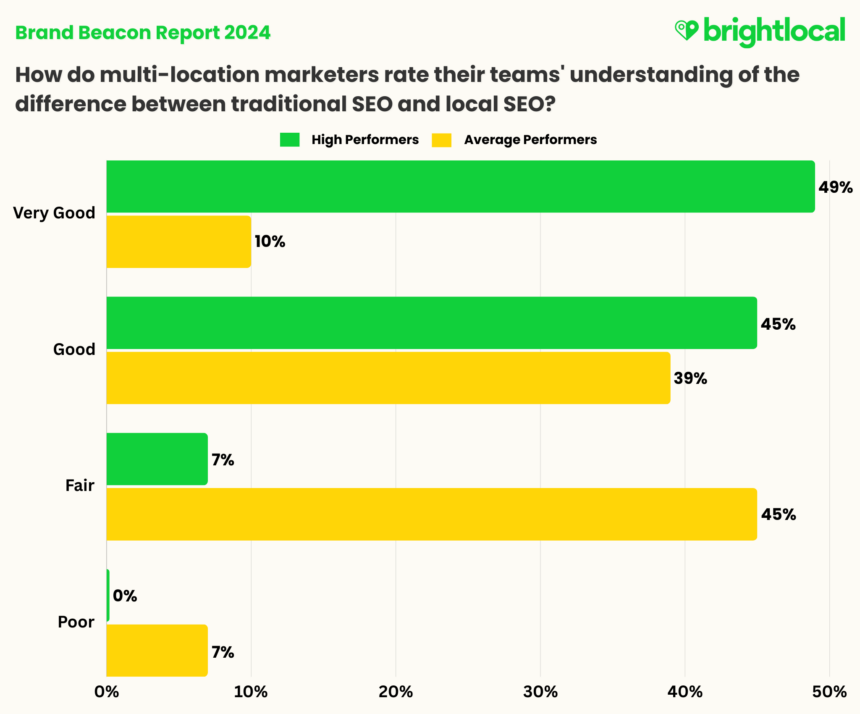
- 93% of marketing teams in the High Performers group have a ‘Good’ or ‘Very Good’ understanding of the differences between traditional SEO and local SEO.
- No one in the High Performers group rated their team’s understanding of local SEO as ‘Poor.’
- Less than half of Average Performers have a ‘Good’ or ‘Very Good’ understanding of the differences between traditional SEO and local SEO.
Examining Local Marketing Teams
With over half of Average Performers stating their marketing teams’ understanding of local SEO as ‘Fair’ or ‘Poor,’ we broke out their marketing team sizes to see how many people are working on local marketing.
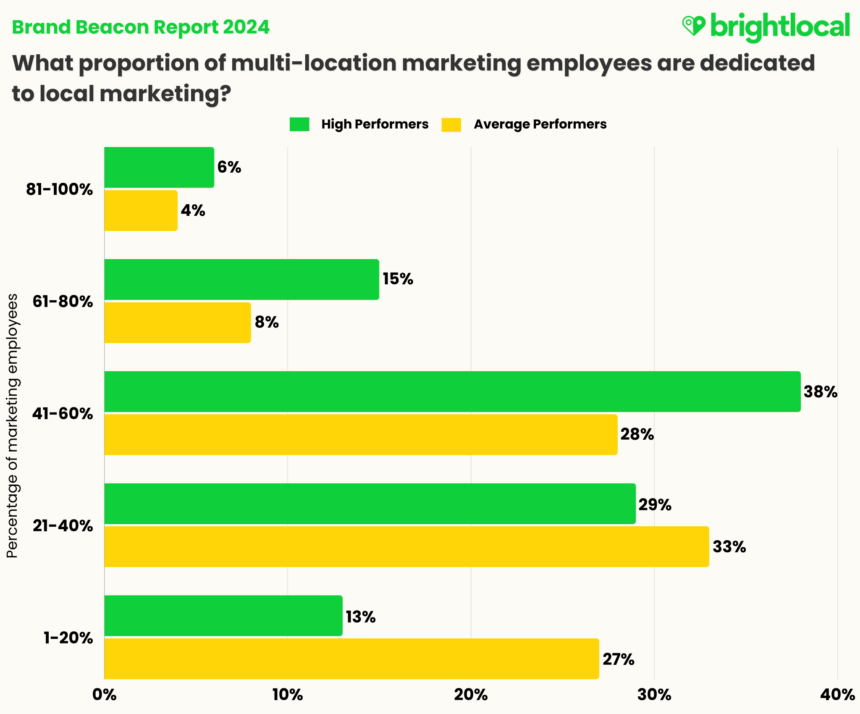
- 59% of High Performers have dedicated more than 40% of their marketing team to local marketing.
- 40% of Average Performers have dedicated more than 40% of their marketing team to local marketing.
- Over a quarter of Average Performers dedicate up to 20% of their marketing function to local marketing.
From this, we can determine that the highest-performing multi-location businesses take local SEO seriously, as they dedicate more resources to teams and strategy in this area.
Marketing Technology and Multi-location Businesses
From the above data, we’ve seen that High Performers and Average Performers treat local SEO differently. Would things change when we asked about the use of technology in local SEO? Would this uncover some opportunities for Average Performers to take note of?
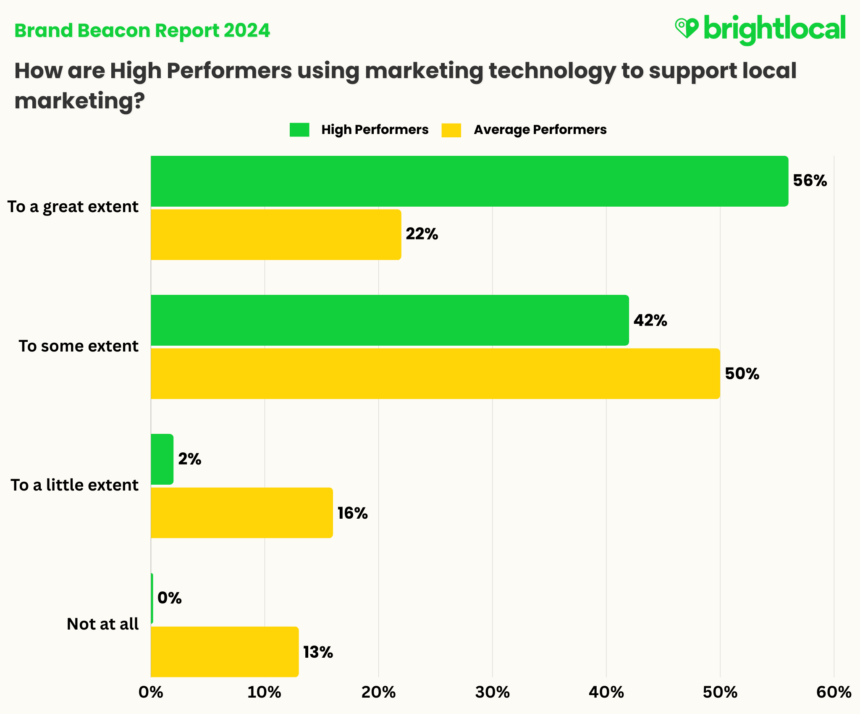
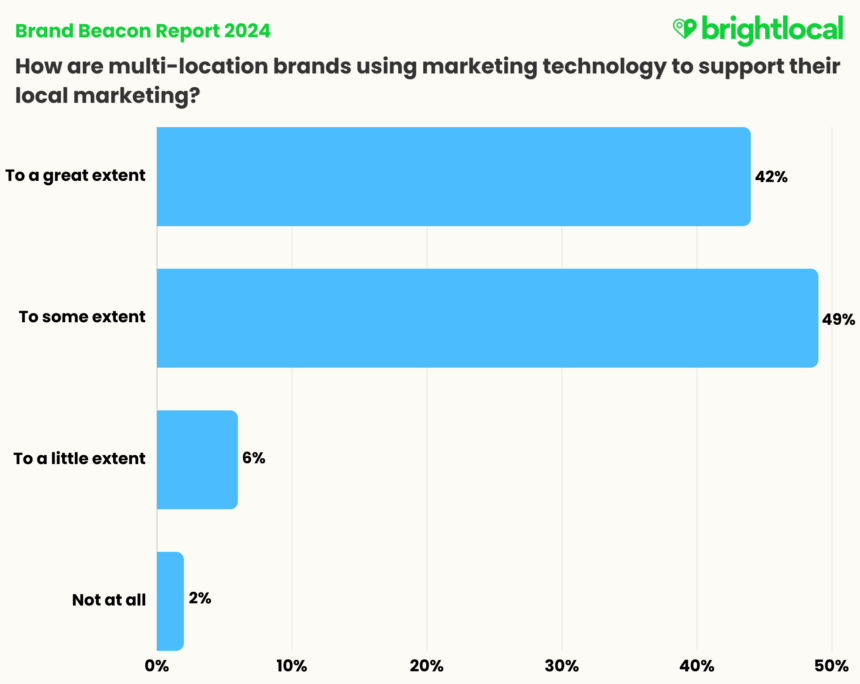
- 98% of High Performers use marketing technology “to some extent” or “to a great extent” to support local marketing, compared to 77% of Average Performers.
- 29% of Average Performers use marketing technology to little or no extent.
The chart above highlights that 100% of High Performers use marketing technology to support their local strategies, with only 2% saying they use it ‘a little’ extent. This is compared to 29% of Average Performers using marketing technology to ‘little’ or no extent.
Only 22% of Average Performers use marketing technology to ‘a great’ extent, compared to 56% of High Performers, suggesting that High Performers see a more significant benefit from their tools. This could be down to team capabilities and whether they have the knowledge or training to use certain tools or have more team resources dedicated to local marketing.
There is clearly an opportunity for underperforming businesses to identify how and where marketing tools can better support their local marketing functions—or where additional training is needed within teams.
High Performers: Further Analysis
Comparing High Performers’ and Average Performers’ business priorities highlights striking differences that could help us understand where that better performance is coming from.
Business Objectives and Future Priorities
We asked marketers what business outcomes their marketing activities are designed around. These core performance areas influence goal-setting (KPIs, OKRs, and similar frameworks) and determine what marketing teams focus on throughout the year.
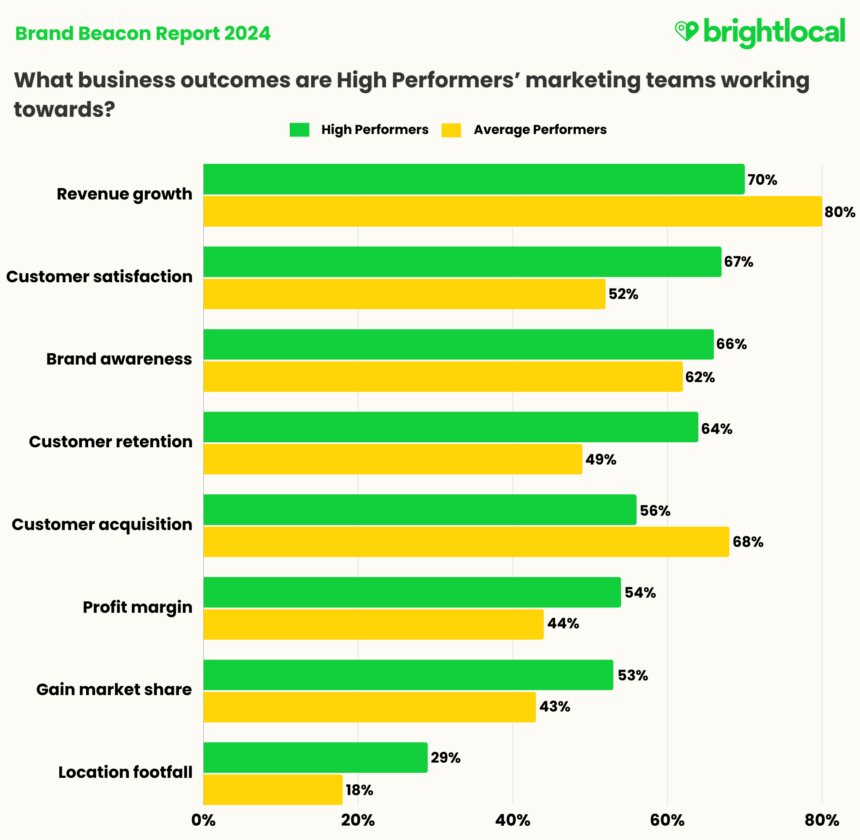
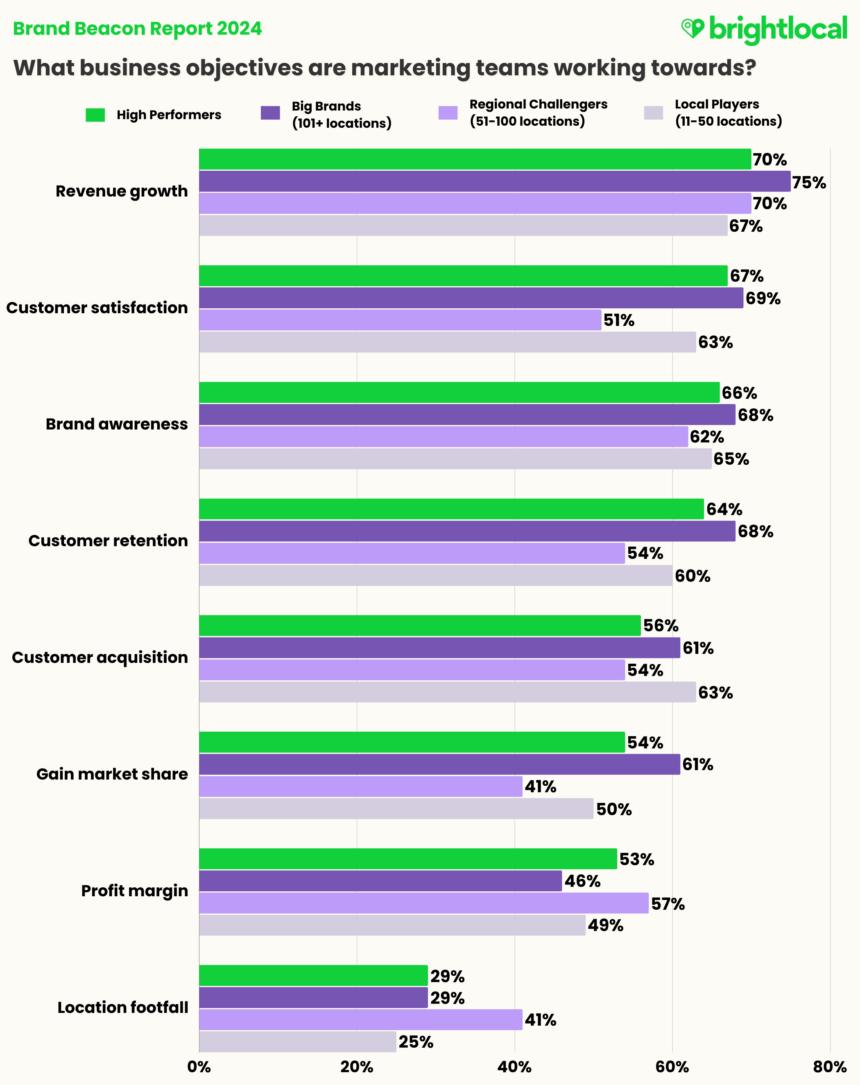
- 67% of High Performers focus on customer satisfaction—15% more than Average Performers.
- 68% of Average Performers focus marketing activities on customer acquisition —12% more than High Performers.
- High Performers are 15% more likely to focus on customer retention than Average Performers.
The results in the chart above reflect a more measured approach for the High Performers, with reasonably equal weighting across the business outcomes. This level only drops off as we come to location footfall, where fewer than one-third of High Performers have said they’re focusing marketing efforts here.
For the Average Performers, however, there are two stand-outs: revenue growth (80%) and customer acquisition (68%).
It would be surprising for businesses not to rely on marketing to support revenue growth. Still, it’s interesting to see customer satisfaction (52%) and customer retention (49%) take more of a back seat for Average Performers.
A lot of research shows that your existing customers are better for your bottom line. Focusing on nurturing a loyal customer base can yield more impressive profits. According to Bain and Co., increasing customer retention by 5% can lead to a 25% profit increase. Meanwhile, evidence also suggests that acquiring a new customer can be up to 25 times more expensive than retaining an existing customer.
So, while focusing on attracting new customers is good for revenue growth, it’s important to consider how marketing teams can contribute to the shared responsibility of customer satisfaction.
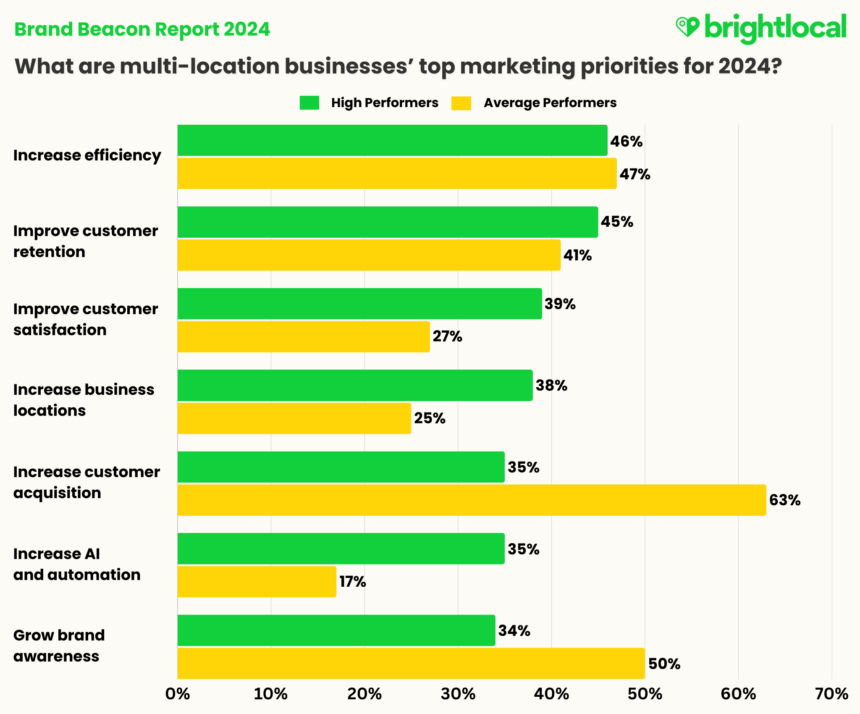
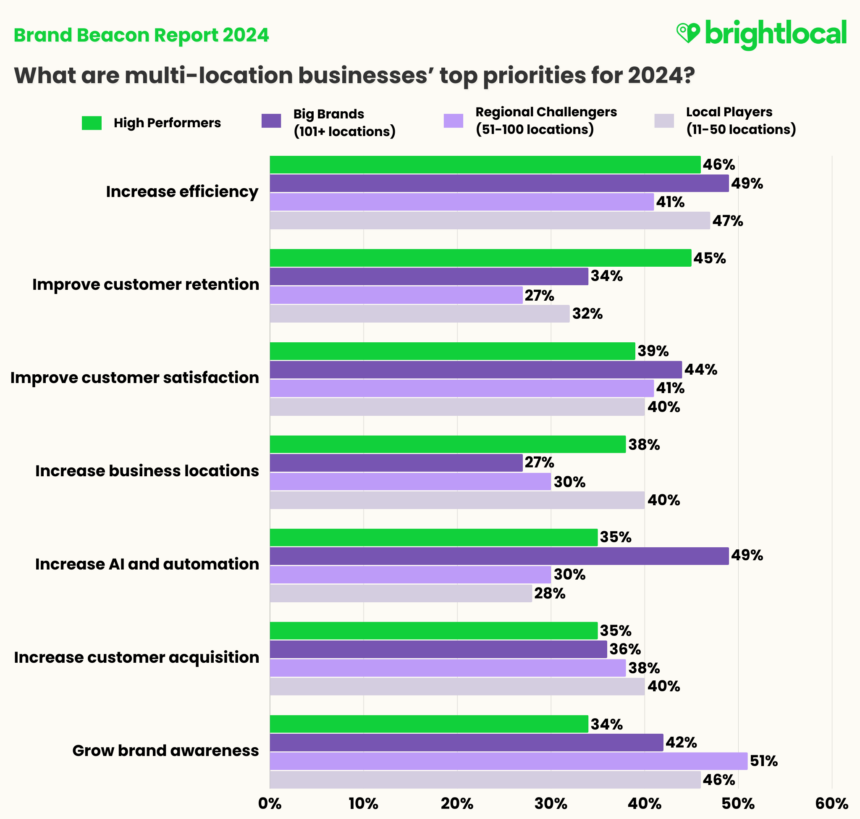
- 39% of High Performers are prioritizing customer satisfaction in 2024, compared to 27% of Average Performers.
- 38% of High Performers highlighted increasing locations as a top 2024 priority, compared to 25% of Average Performers.
- 35% of High Performers highlighted increasing AI and automation as a top 2024 priority, compared to just 17% of Average Performers.
Comparing the two charts above, we can see that High Performers are prioritizing things with a measured approach that aligns with their core marketing outcomes.
We see a continued commitment to strengthening existing customer relationships and building brand loyalty—and plans to increase locations (38%) and acquire new customers (35%).
The data from Average Performers, on the other hand, tells a markedly different story. Customer acquisition sits at the top of their 2024 priorities (63%), followed by increasing brand awareness (50%) and increasing overall efficiency (47%).
Considering the Average Performers have reported only just meeting performance expectations—or even falling short—and are also looking to increase efficiency in 2024, you’d hope to see a more balanced approach in their priorities. Customer acquisition sitting squarely ahead of other key priorities, like improving customer satisfaction, suggests a misunderstanding of what it takes to achieve business (and revenue) growth.
As we’ve touched on, customer satisfaction and retention can be significantly more cost-efficient for brands. But from a reputation perspective, we mustn’t underestimate the sheer power of brand loyalty here, too. While your existing customers are often happier to try your new products and services, you should also consider how a base of loyal customers can lead to brand awareness via their advocacy.
Implementing Local Marketing Tactics
Let’s look at the marketing tactics businesses are working with. In doing so, we might be able to highlight just what the High Performers are getting right—and understand some areas where our Average Performers are missing opportunities.
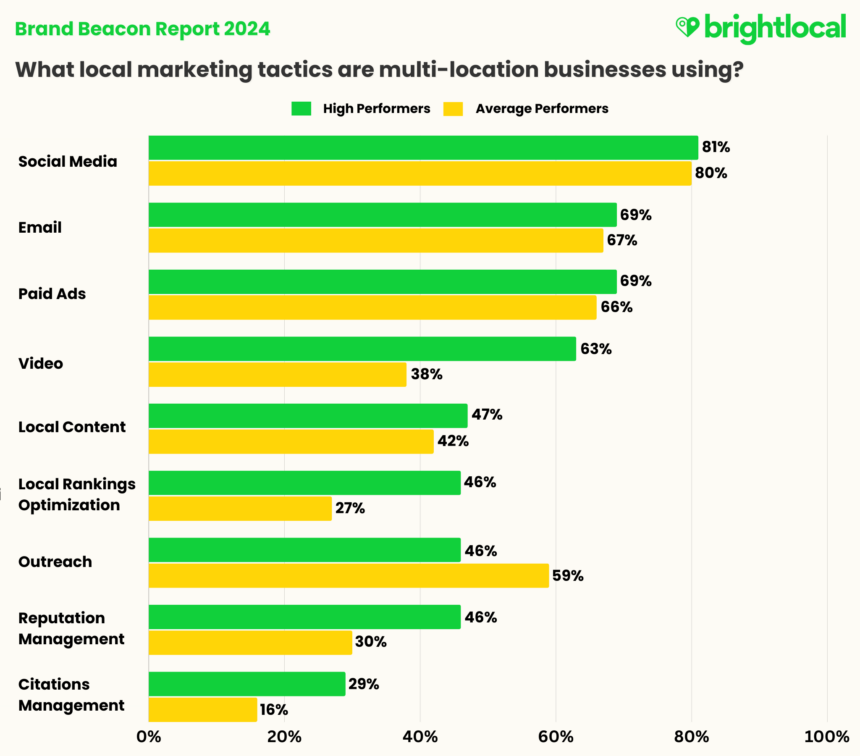
- High Performers are 25% more likely to use video as a local marketing tactic than Average Performers (63% vs. 38%).
- High Performers are 16% more likely to focus on reputation management as a local marketing tactic than Average Performers (46% vs. 30%).
- Average Performers are 13% more likely to be using outreach for local marketing than High Performers (59% vs 46%).
Similar proportions of High Performers and Average Performers use social media, paid advertising, and local content as local marketing tactics.
The key areas where the High Performers are focusing more are video, local rankings optimization, reputation management, and local citations. However, the local marketing tactic that Average Performers rely on significantly more than High Performers is outreach (59% vs. 46%). This finding, and their focus on customer acquisition above all else, suggests that Average Performers have been over-reliant on outreach marketing to fulfill this goal.
Video marketing can be tricky to implement if the budget and talent are hard to find, but it’s clearly an area that High Performers are taking advantage of more than Average Performers. If you’re reading this and your brand isn’t currently working on video, it’s worth considering where you can start. Could you take a handful of your locations as a test and see what results it yields?
While video sits much more in brand awareness and engagement, the remaining three tactics that High Performers use more than Average Performers (local rankings optimization, reputation management, and citations) are fundamental to ensuring visibility in the right places, so that the right people can find you with the search terms you want to be found for.
Example: Local Marketing Tactics for Search Visibility
If a customer has a specific brand in mind, like Home Depot, they might head straight to Google Maps and type it in. They might also search, in Google or Google Maps, for something they’d specifically like to buy there, like ‘outdoor furniture’.
There are several things to consider if you are a competitor.
Could Home Depot be ranking in these results because it’s categorized on Google Business Profile as a ‘Home improvement shop’, while your business is labeled as a ‘Hardware shop’?
Has Home Depot listed any available products, services, or departments on its Profile that you haven’t?
Of course, it’s not quite that simple. But these local marketing tactics, like local rankings optimization, reputation management, and citations management, are widely believed by experts to be Local Ranking Factors, and therefore essential to ensuring your visibility in local rankings.
Paid advertising can go a long way in helping prospective customers find your brand online, but if they continue to do their research and find inconsistent—or just plain terrible—reputations in business profiles on Google or Yelp, they will stick with what they know.
Analyzing Multi-location Strategies by Business Size
Challenges, tactics, and strategies all change with scale. The more locations you work with, the more complex the marketing will be.
Now that we’ve looked at what marked High Performers out against the rest of the pack, let’s take a look at how multi-location businesses of different sizes compare.
First, let’s recap how we defined these business sizes:
- Big Brands: businesses with 101+ locations
- Regional Challengers: businesses with 51-100 locations
- Local Players: businesses with 11-50 locations
We’ll start by looking at business objectives for the coming year.
Business Objectives, Priorities, and Challenges
- Regional Challengers are prioritizing customer satisfaction (51%) and customer retention (54%) the least out of all groups, but prioritizing profit margin (57%) and location footfall (41%) significantly more than the other sizes.
- Big Brands are prioritizing profit margin the least out of all the groups (46%).
The Top Three Marketing Objectives Multi-location Businesses Have Been Working Towards
| 1. | ||||
| 2. | ||||
| 3. | Customer retention (68%) | Customer retention (54%) | Customer acquisition (63%) |
Much like the High Performers, Big Brands appear to show the most consistency in evenly weighting their business priorities. The two lowest priorities, where the percentages drop more, are profit margin and location footfall.
However, the biggest gaps between the groups appear to concern the Regional Challengers. 51% of Regional Challengers said their marketing activities focus on customer satisfaction, compared to the High Performers benchmark level of 67%. The next biggest gaps appear in gaining market share (41% against the High Performers benchmark of 54%) and customer retention (54% compared to the High Performer benchmark of 64%).
If your brand falls within the Regional Challengers group, you might see this as a chance to review your current marketing output. Are there some missed opportunities around these areas?
As we’ve already found, a relationship exists between underperforming brands and their prioritization in attaining new business over satisfying existing customers. It looks like Regional Challengers are following a similar pattern.
Another interesting difference is how Regional Challengers appear to focus on specific location footfall over the other groups. Again, it does suggest a ‘quantity over quality’ imbalance. Are Regional Challengers focusing too much on increasing feet through the door when they could be increasing the average basket spend, for example?
- The High Performers benchmark for customer retention (45%) is significantly higher than individual business sizes.
The Top Three Marketing Priorities for Multi-location Brands in 2024
| 1. | ||||
| 2. | ||||
| 3. | Improve customer satisfaction (40%) Increase business locations (40%) |
When looking at the different sizes of multi-location businesses and their priorities, we can see some interesting differences between the groups.
Firstly, the Local Players, Regional Challengers, and Big Brands are generally far behind the High Performers benchmark with customer retention. It’s a theme that keeps cropping up and provides all the more reason for multi-location businesses of all sizes to pay attention to this area.
Discussion: Do multi-location marketers see retention as more of a focus for other teams within their business, or is increasing customer numbers seen as an easier win? We’d be really interested to hear about your experiences. Tell us what you think! Share your thoughts with us on X, LinkedIn, or in our Facebook community, The Local Pack.
You’ll notice that nearly half of our Big Brand respondents (49%) have highlighted AI and automation as a focus area for 2024.
Artificial Intelligence in itself is not a new concept. However, the constant—and very newsworthy—developments in generative AI throughout 2023 have put the words into every marketer’s mouth.
Since the boom of generative AI, larger brands and market leaders will likely face higher pressure to adopt new AI-driven technologies than smaller-sized organizations. There is somewhat of an expectation to “keep up” with the others in the big leagues.
Retail, hospitality, and entertainment feel like obvious examples of where you might expect to see this in the mainstream. Plenty of brands are rolling out implementations of generative AI in digital environments to aid customer experiences. Will we start to see this in physical environments, too?
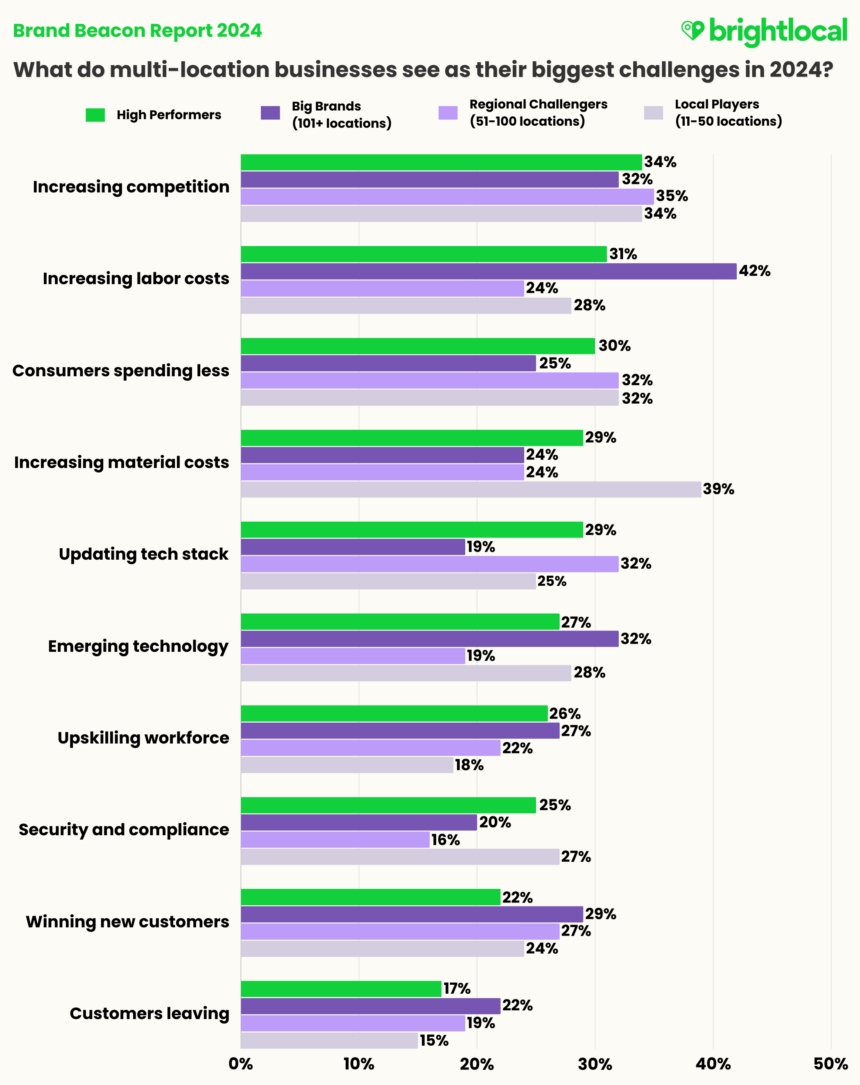
- 42% of Big Brands cite increasing labor costs as a key challenge for 2024, against 24% of Regional Challengers.
- 39% of Local Players feel increasing material costs will be a big challenge in 2024.
- 35% of Regional Challengers cite increasing competition as one of the biggest challenges in 2024.
We asked marketers about their top three challenges for the year ahead, and the groups have some notable differences.
As we’ve seen with Big Brands prioritizing AI in 2024, it’s a no-brainer that they’ve also placed emerging technology as one of the biggest challenges for this year. Their top challenge, however, is increasing labor costs, with 42% of this group agreeing that this is one of the biggest current issues. Without getting too conspiratorial, is one of these challenges seen as an opportunity to resolve the other?
It’s worth looking further at the responses around technology here: compared to the 42% of Big Brands, only 19% of Regional Challengers are worried about emerging technology in 2024. Yet when it comes to updating their existing tech stacks, 32% of Regional Challengers see this as a big challenge for 2024. This is higher than Big Brands (19%), Local Players (25%), and the High Performers benchmark of 29%.
What could this suggest? Perhaps Big Brands don’t view their tech stack as a problem, or maybe their focus is slightly clouded by the genAI race. If the latter is the case, it would be interesting to see what challenges they may encounter later, in terms of integrations and streamlining.
We can see that Regional Challengers aren’t currently getting the most out of their tech stacks, and may well seek to update these in 2024.
Regional Challengers see increasing competition as the biggest challenge (35%). This goes hand-in-hand with their top priority for 2024: brand awareness (51%). There’s clearly an awareness of, and a need to, raise brand profiles to remain competitive.
Local Players see increasing material costs as their biggest challenge in 2024. It makes sense, as smaller brands may have less bargaining power in the buying market and will likely feel the squeeze of increasing costs more than larger competitors.
If this is their biggest business concern, it also makes sense that they would be less concerned with technological advances, either in their tech stacks or in adopting emerging technologies.
Local Marketing Deep-Dive
The Importance of Strategy and Knowledge
When putting together our questions for respondents, we hypothesized that the bigger the brand size, the more mature its local marketing strategy would be—that is, having a dedicated local strategy in place and a team with a strong understanding of the nuances between local and traditional or typical SEO.
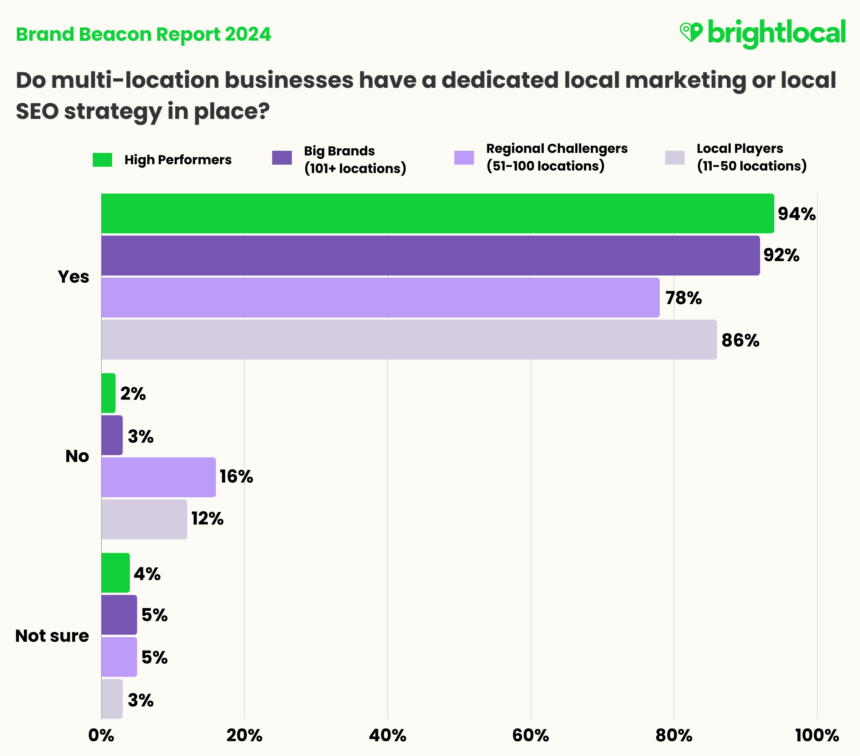
- 92% of Big Brands have a dedicated local marketing strategy, the closest to the High Performers benchmark of 94%.
- Businesses with 51-100 locations (Regional Challengers) are the least likely to have a local SEO strategy in place (16%), followed by Local Players (11-50 locations).
Proportionately, the Big Brands show more local SEO maturity, with 92% stating that a dedicated strategy is in place. This is just two percentage points behind the High Performers benchmark, which generally reinforces an assumption that Big Brands would have more mature local SEO practices.
As we found earlier, 10% of all businesses do not have a local marketing strategy (and 4% were unsure if they did). So, we can see from the chart above that this segment is mostly made up of representatives from Regional Challenger and Local Player-sized businesses.
However, you’ll notice that Local Players are more likely to have a local marketing strategy in place than Regional Marketers. Why might this be?
It could be that Local Players, having a smaller (and possibly more concentrated) portfolio of branches, have a better understanding of their markets and local area requirements. Brands in the Regional Challengers group are more likely to have experienced a rapid period of expansion in recent times, meaning that a more comprehensive strategy is needed—or that their previous one no longer fits.
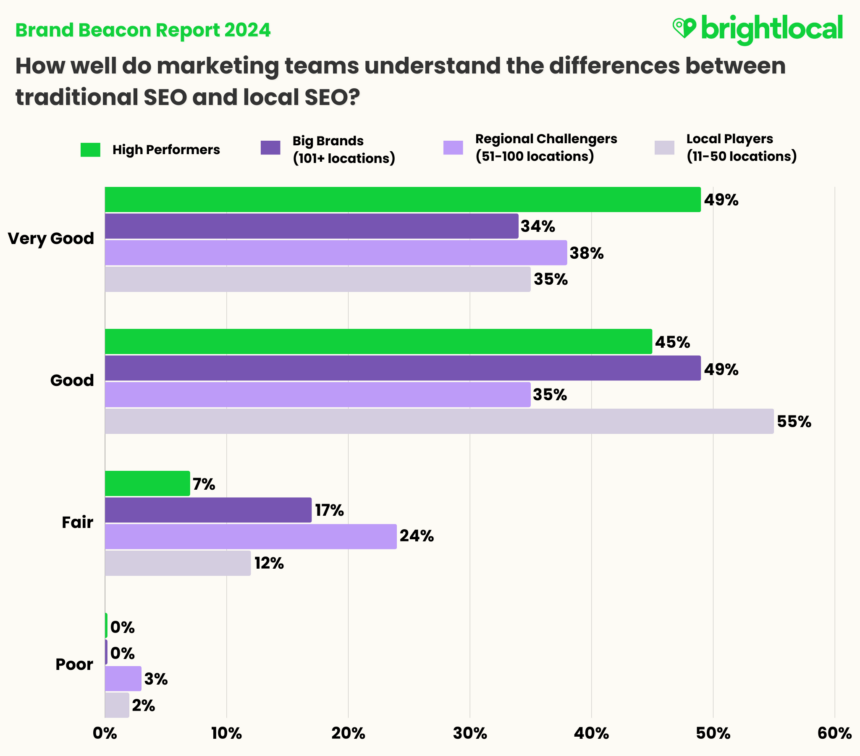
- Regional Challengers appear to have the biggest gaps in local SEO knowledge, with 27% claiming their teams have a ‘Fair’ or ‘Poor’ understanding.
- Local Players are the closest group to the High Performers benchmark (94%), with 90% stating a ‘Very good’ or ‘Good’ understanding of the differences between traditional SEO and local SEO.
90% of Local Players rate their marketing teams’ understanding of local SEO as ‘Good’ to ‘Very Good’, compared to 83% of Big Brands, 73% of Regional Challengers, and against the High Performers benchmark of 94%. Why might Local Players be the most knowledgeable?
It could well be that that greater local marketing maturity is not achieved simply by being a larger business that has existed in the space for longer. Instead, it could suggest that local marketing maturity is ‘elastic’: it develops and changes as the requirements of a brand also change.
Understanding of local area requirements will vastly differ when a business goes from 11-50 locations to hitting a milestone of 100 and scaling up further to the nationwide level.
Local Marketing Tactics in Action
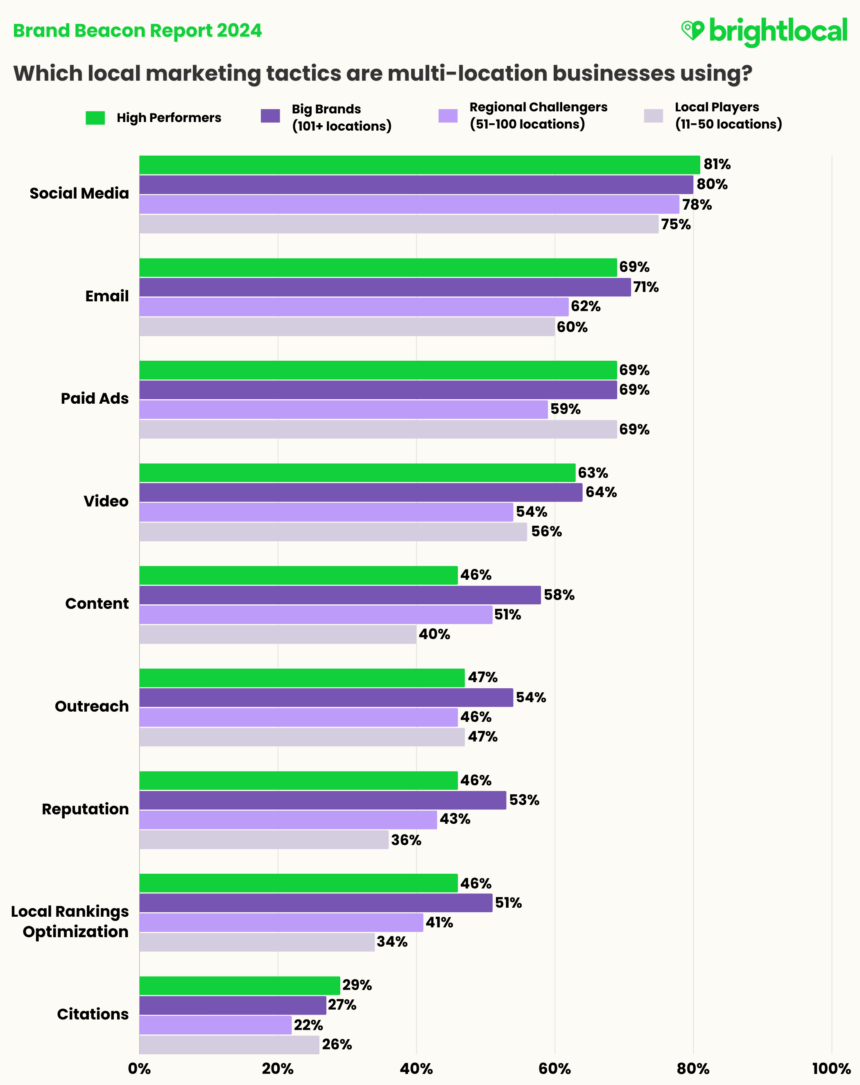
- Big Brands appear to be the biggest users of local-specific content (58%), while just 40% of Local Players implement this tactic.
- 69% of Big Brands and Local Players use paid ads as a local marketing tactic, compared to 59% of Regional Challengers and 61% of High Performers.
Analyzing local marketing tactics by business size, we can see that Big Brands broadly follow the High Performers benchmark by investing in a wide range of tactics rather than a select few.
Citations and business listings are important for brands of all sizes to ensure that business information is consistent and uniform online. This challenge only gets greater for Big Brands, as having hundreds or even thousands of locations to update and maintain becomes more difficult and time-consuming.
We’ve covered just a few of the detrimental effects of incorrect business information on brand reputation in the Local Business Discovery and Trust Report 2023.

The Smarter Way to Manage Listings
Discover a cutting-edge solution for effective listings management
There are some tactics that Big Brands appear to be investing in more than High Performers, which could suggest that they are spending too much time (or money) in some areas. The most notable example of this is local-specific content (58% vs. 46% for High Performers).
Too much content can be a problem, particularly if it confuses or cannibalizes your SEO efforts or jeopardizes your user experience. This could even be a legacy issue as SEO best practices have evolved.
While content is still vital for boosting visibility and building trust by reflecting your expertise and authority (see: Google’s E-E-AT), there was a time when brands and agencies thought that churning out reams of ‘fresh’ content was the answer. Some brand marketers may not be up to date on the latest SEO best practices or no longer work with agency partners, so could be over-reliant on some tactics they feel they understand well.
In the data above, Regional Challengers appear to be using social media, email marketing, and paid advertising the most as local marketing tactics. Against the High Performers benchmark, the gaps that highlight some potential opportunities for them are video, local rankings, citations, and reputation management.
While we previously highlighted the difficulties of video marketing, this tactic may actually present an opportunity for some business sizes and types. Where Big Brands are pretty much using the tactic in line with High Performers, we notice a gap between them and Regional Challengers and Local Players, suggesting there may be a chance for the latter two groups to learn from what the most successful brands are doing.
Email marketing tells a similar story to video, highlighting how Big Brands use it more than Regional Challengers and Local Players. It’s always a good idea to look at what competitors are doing, or even brands in other industries, to highlight areas of opportunity and improvement in your own marketing. Could Big Brands be using email as a customer loyalty tool, nurturing customer segments with tailored content that isn’t just sales-led?
Gap Analysis: Search Marketing Tactics
Local rankings and reputation management are two areas in which Local Players seem to be fairly behind, compared to both the High Performers benchmark and their peer groups. They’re also the least likely to use local content (40%) out of all the groups.
If we group all of the marketing tactics by the outcomes they’re designed to impact, we can see a theme as far as content, reputation, local rankings optimization, and citations are concerned: the importance of search visibility.
| Social media | |||||
| Paid advertising | |||||
| Video | |||||
| Content | |||||
| Outreach | |||||
| Reputation | |||||
| Local rank tracking/optimization | |||||
| Citations |
It’s worth remembering that your competitors aren’t necessarily just the biggest names or the market leaders in your industry. In the multi-location world, you must also consider who else is in your potential customer’s proximity.
Without focusing on key visibility tactics and hoping to get by on brand name alone, you run the risk of failing on other fundamental areas that can turn people away—being outranked in the local map pack, incorrect or inconsistent business information causing confusion, and avoidable negative reviews.
Other Findings: AI, Economic Outlook, and Channel Investment and Impact
Despite only hitting the mainstream at the start of 2023, generative artificial intelligence has already caused a dramatic influx of new ‘AI-assisted’ tools aimed at both business and consumer audiences.
In August 2023, our own Local Search Industry Survey found that 93% of local marketers had already experimented with AI tools. So, in the question below, we wanted to know to what extent generative AI is now used at the multi-location scale.
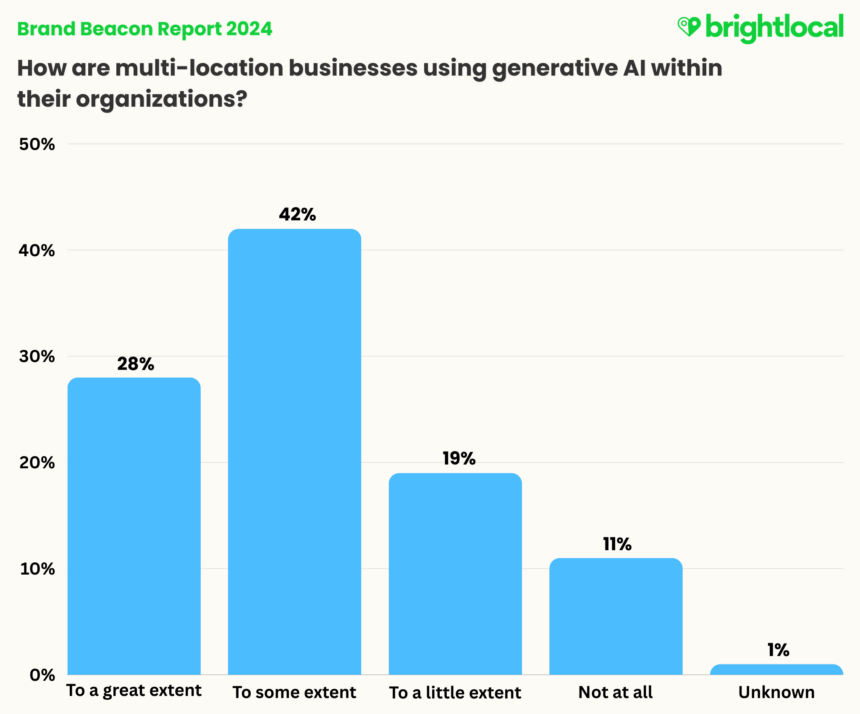
- 88% of multi-location businesses are already using generative AI.
- 28% of multi-location businesses say they are using generative AI “to a great extent”.
- Only 11% of multi-location businesses aren’t using generative AI “at all”.
70% of marketers state that generative AI is used “to some extent” or “to a great extent,” suggesting that the technology has made waves within these organizations.
Furthermore, when asking those who are investing about the returns seen so far, it appears that generative AI mostly exceeds expectations.
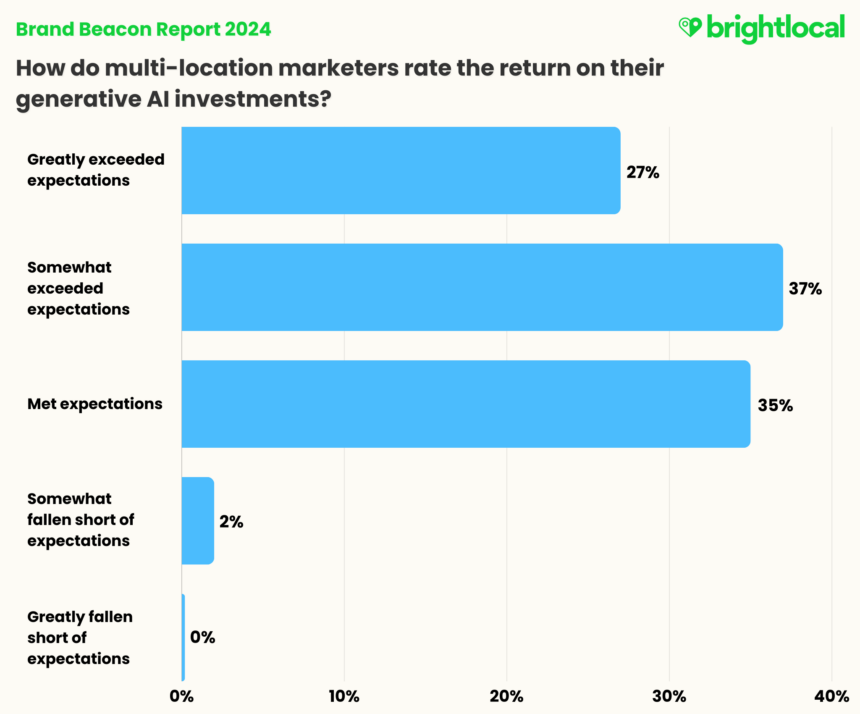
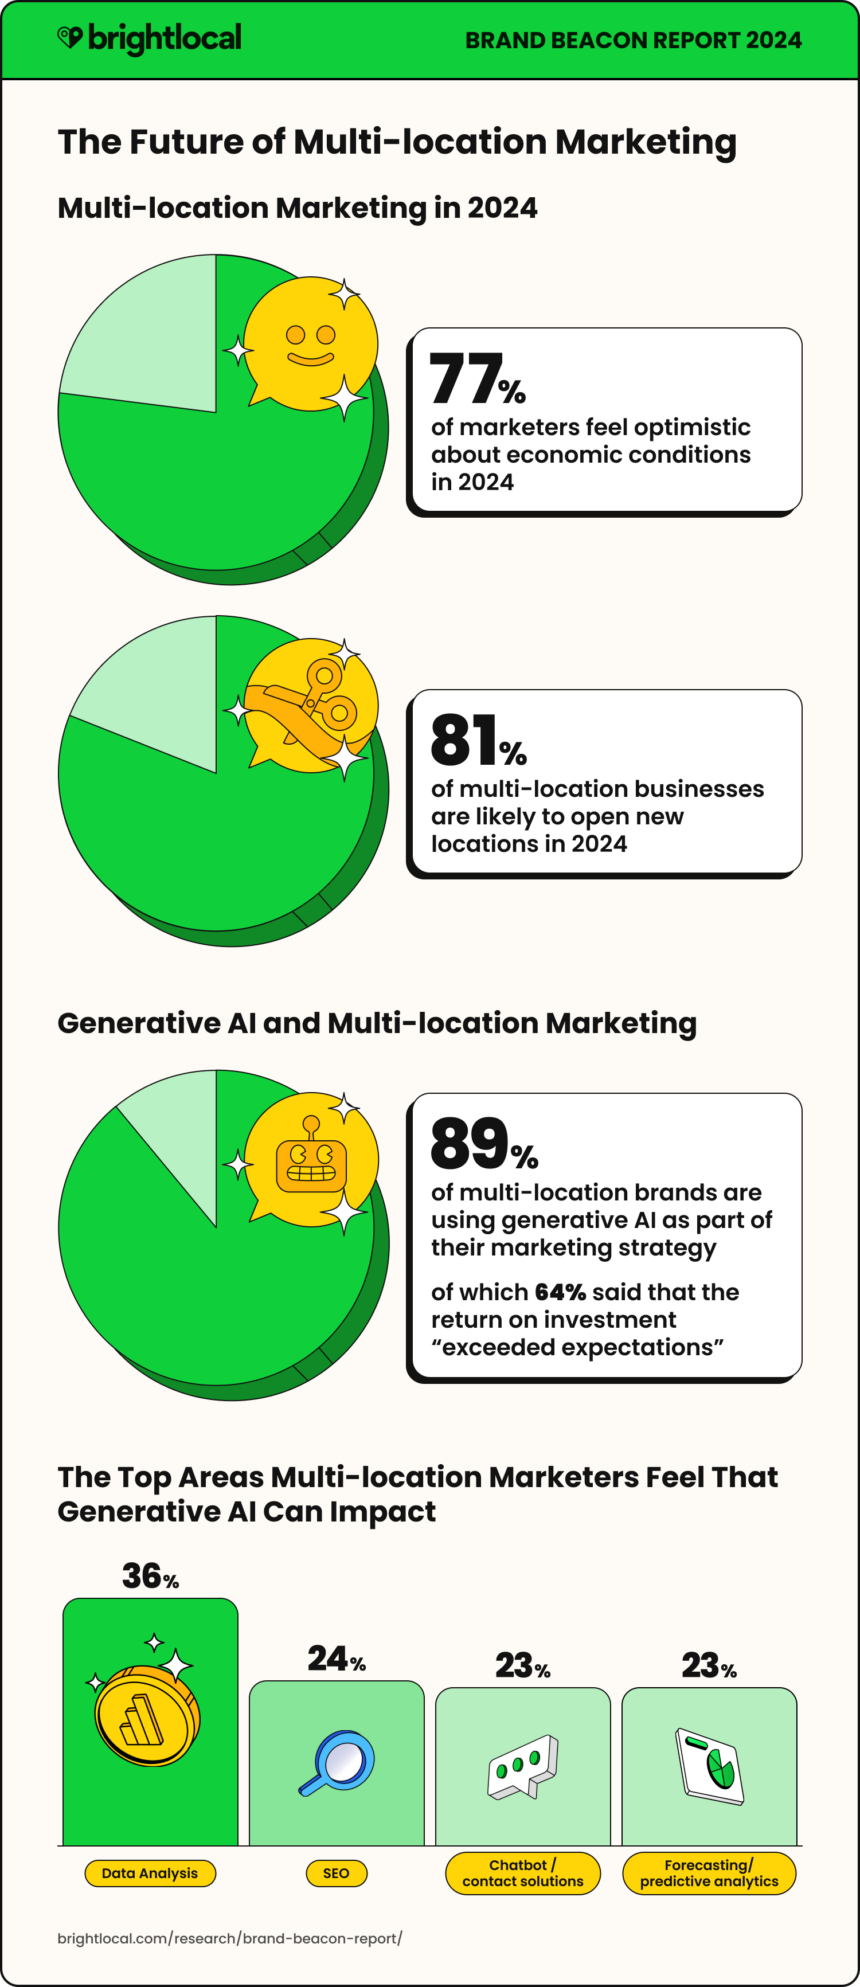
- 64% of multi-location businesses said the ROI of generative AI has exceeded expectations.
- 98% of multi-location businesses said the ROI of generative AI has “met or exceeded expectations”.
- Just 2% of multi-location businesses felt the return of their generative AI investments fell short of expectations.
We’ve seen many examples of brands using generative AI in fun and clever ways for digital and out-of-home advertising and social content. It can leverage strong brand USPs and positioning surprisingly cost-effectively: take this advertising battle between McDonald’s and Burger King, for example.
So, where do multi-location see the biggest opportunities with the continually evolving tech? We asked marketers to select up to three areas.
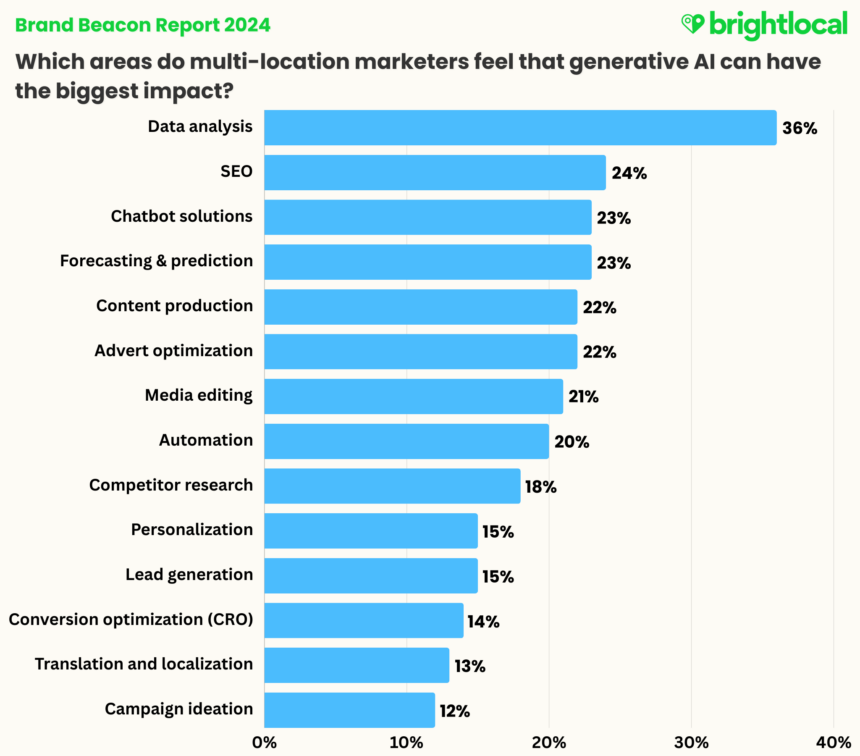
It looks like marketers are looking for assistance with more technical endeavors than creative ones. 36% of marketers highlighted data analysis as an area that generative AI can impact the most, while 24% highlighted SEO, and 23% cited forecasting and prediction.
While it’s easy to first think of generative AI’s capabilities to create new, original media, there are a whole host of genAI tools in the market specifically designed to assist with—and speed up—data analytics. Creating engaging data visuals and summarizing vast amounts of data to provide impactful insights are just two use cases for such tools.
However, that’s not to say that ‘data analytics’ can’t lend itself to other areas, like personalization, in order to create unique experiences. Think about personalized menu recommendations for restaurants, virtual ‘try-on’ experiences in retail outlets, or custom fitness profiles in gyms and health centers. This term also encompasses ‘forecasting and prediction’, of which data analysis is the very heart.
As the technology continues to evolve, though, there’s no doubt we’ll see opportunities and use cases for all industries unfolding.
Looking for more on generative AI? You can find our takes on generative AI, as well as a case study, a local marketer poll, and an expert column on the topic in our AI Insights.
Economic Optimism in 2024
How are multi-location marketers feeling about the year ahead? The good news is that businesses say they are looking pretty resilient and, as we’ve seen above, are already making strides in how they’re adopting and adapting to new technologies.
Despite economic challenges, the sentiment among multi-location marketers for the year ahead is high, with 77% feeling optimistic about 2024’s economic conditions.
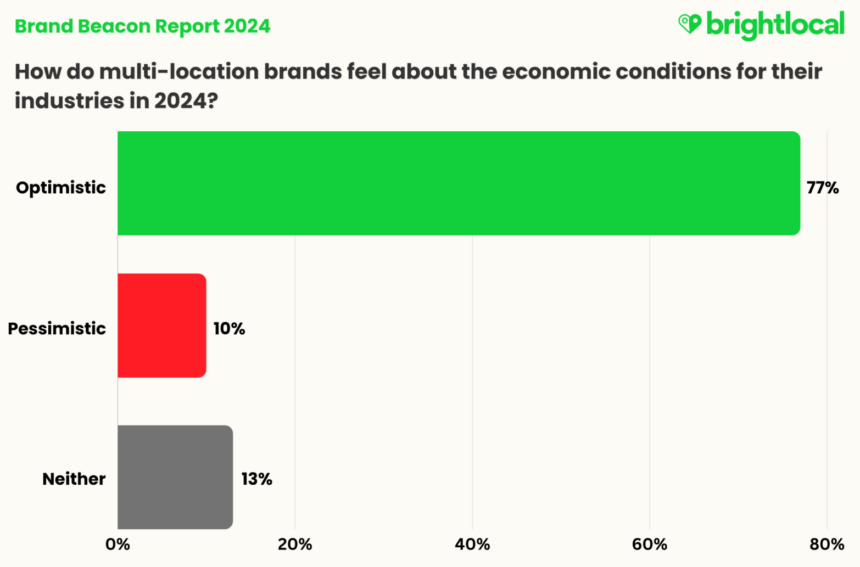
Only 10% of multi-location businesses feel pessimistic about the economic conditions ahead of them in 2024.
On top of this, brands also have a good appetite for business expansion.
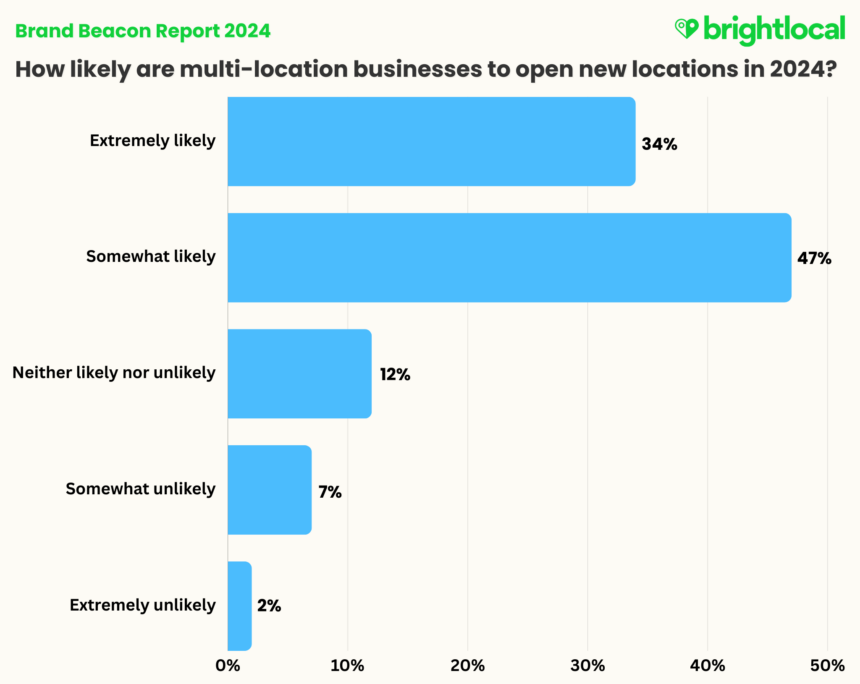
81% of multi-location businesses told us that they are likely to open new locations in 2024. So, despite the challenges discussed earlier in the report, the multi-location business landscape is staying positive and ready to tackle what comes its way.
Channel Investment and Impact
We’ve previously discussed marketing channel investment at a high-performance level. In this next section, we’ll go further to take a look at the impact that marketers are seeing on their revenues as a result of channel investment.
Scoring Investment and Impact
Obviously, only marketers who have told us that they invest in particular marketing channels can report on the level of impact they see from them. Therefore, these two questions cannot be directly comparable:
Question 1: How much are you investing in the following areas of marketing for your organization? – High Investment, Medium Investment, Low Investment, No Investment.
Question 2: Which of the following delivers the most impact on revenues for your organization? – High Impact, Medium Impact, Low Impact, No Impact.
In order to analyze and compare investment and impact properly, we created a channel investment and impact scoring system. We assigned a score based on whether a channel had high (10), medium (6), or low (3) investment to create an Investment Score (out of ten, with zero being “no investment”) and used the same approach to create an Impact Score (out of ten, with zero being “no investment”).
Example: High Performers Social Media Impact Score
High impact (10) x number of respondents (64) = 640
Medium impact (6) x number of respondents (49) = 294
Low impact (3) x number of respondents (10) = 30
Sum of High, Medium, and Low impact = 964
Total number of respondents to question: 123
Sum / Total: Impact Score of 7.8/10
We’ve summarized each group with some key findings below.
High Performers vs. Average Performers
- High Performers invest more than Average Performers in 9 our of 10 marketing channels.
- Average Performers invest more in PPC than High Performers.
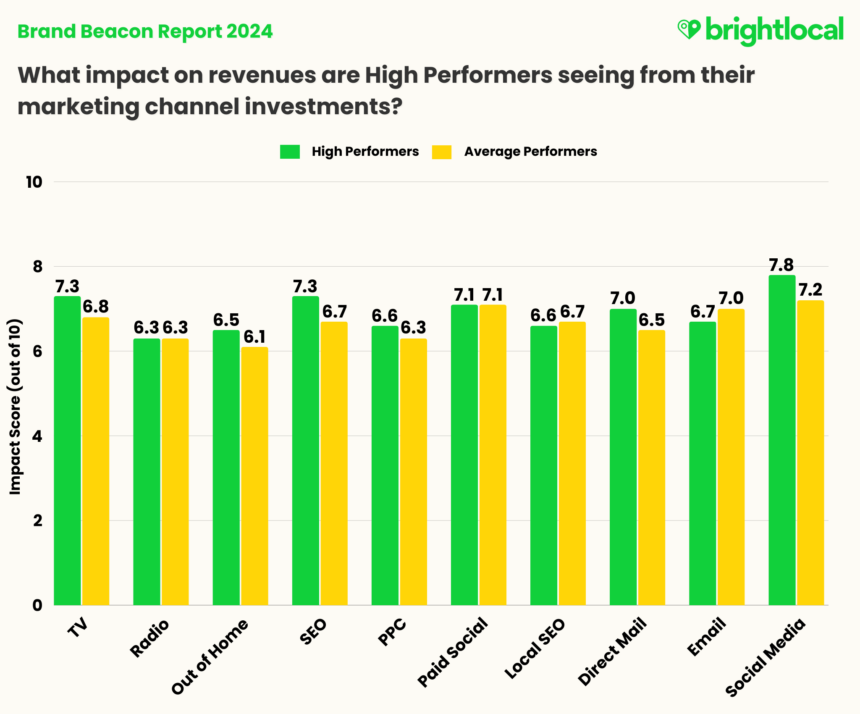
- High Performers see a good impact on revenue from SEO, considering their investment level (7.0 Investment Score vs. 7.3 Impact Score).
- Despite lower investment than Average Performers in PPC, High Performers see a better impact on their revenue in this area (5.9 Investment Score vs. 6.6 Impact Score, against 6.3 respectively for Average Performers).
Local Players
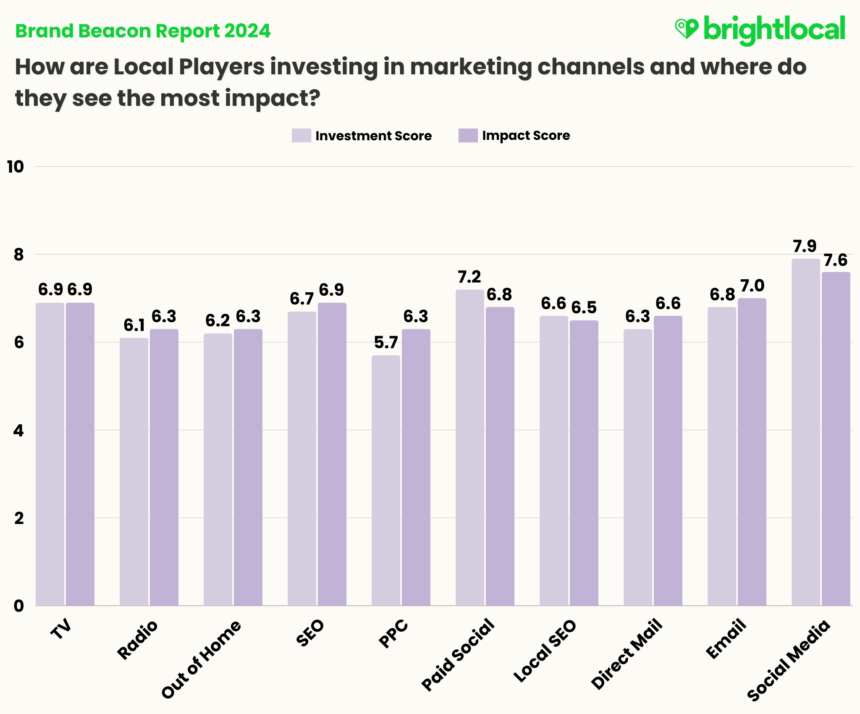
- Local Players see the most impact on revenues from social media (7.6/10).
- The channels seeing the highest impact on revenues are PPC and Direct Mail.
- Local Players are investing the least in PPC among their marketing mix.
Regional Challengers
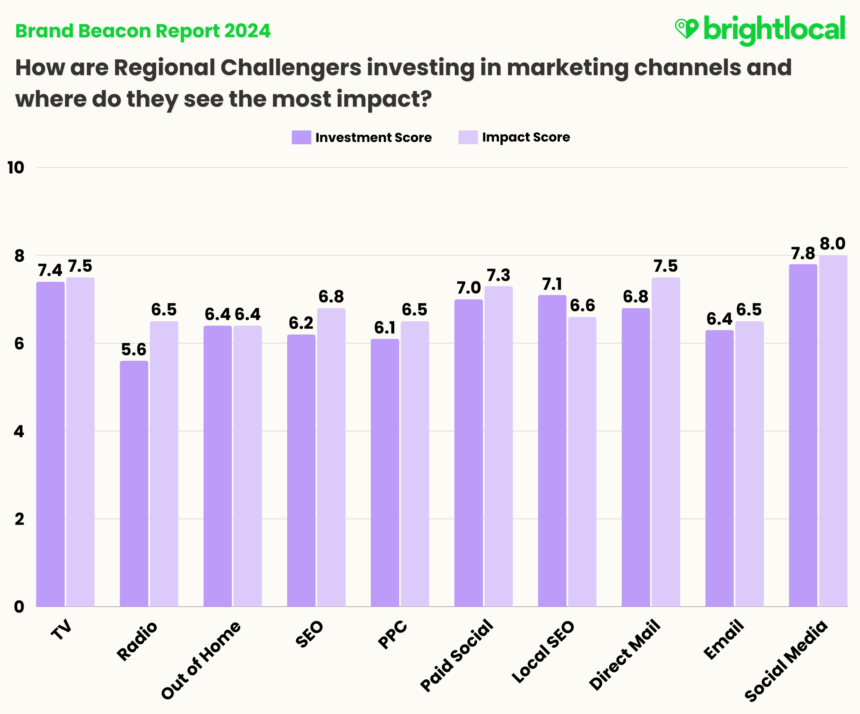
- Regional Challengers see the most impact on revenues from social media (8/10).
- The channels seeing the highest impact on revenues are Radio, Direct Mail, and SEO.
- Regional Challengers are investing the least in radio advertising out of all channels—but the impact for those investing is fairly strong (5.6 investment score vs. 6.5 impact score).
Big Brands
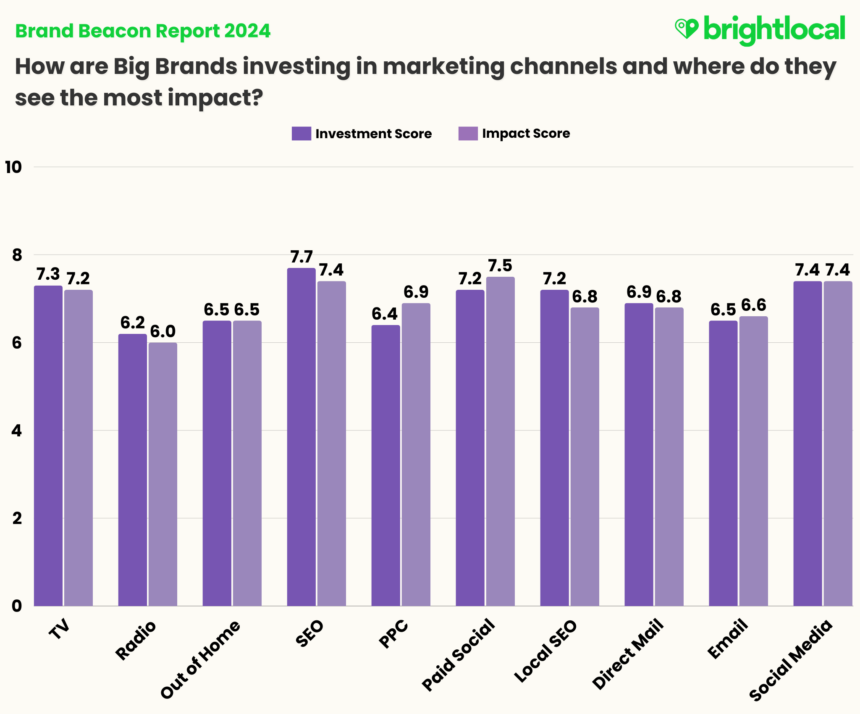
- Big Brands are seeing the highest impact on revenues from paid social (7.5/10) compared to the other channels.
- The channels seeing a higher impact on revenues are PPC and Paid social.
- Out of all the channels listed, Big Brands invest the least in radio advertising.
- Big Brands appear to see the least impact on revenues from SEO (7.7 investment vs 7.5 impact).
Summary
If your marketing performance fell short of expectations in 2023, we’re not here to tell you to increase your local marketing function by a certain percentage or that adopting new marketing tech will immediately boost your results.
But the beauty of benchmarking is that it allows you to lift your head out of the sand (or various other reports) and consider opportunities for improvement: to compare what competitors in the multi-location marketing space are doing and pinpoint why they may have been outperforming you.
Perhaps your team has even had a hunch about implementing a particular tactic or tool and has not quite had a case to prove to unlock some budget. We hope that this report’s findings will help strengthen that case for you and highlight new areas to think about.
One thing stands out for sure, though, and that is the overarching importance of local marketing in contributing to brand performance. It’s clear from our benchmarking that brands with dedicated, knowledgeable local marketing teams and local-specific strategies in place are outperforming others.
When looking at individual local marketing tactics, too, we can see that High Performers are implementing many that others aren’t yet. Local rank tracking and optimization, reputation management, and citations reflect the continued importance of ensuring and maintaining brand visibility in increasingly competitive local environments.
So, how is your brand measuring up? If you have any thoughts about the Brand Beacon Report 2024 research and findings, we’d love to hear from you. You can share your thoughts with us on X, LinkedIn, or our own Facebook community, The Local Pack. Alternatively, you can contact [email protected] with any questions.
Publishers and individuals are welcome to share findings and charts from this report, crediting BrightLocal and the URL https://www.brightlocal.com/research/brand-beacon-report/.
Methodology
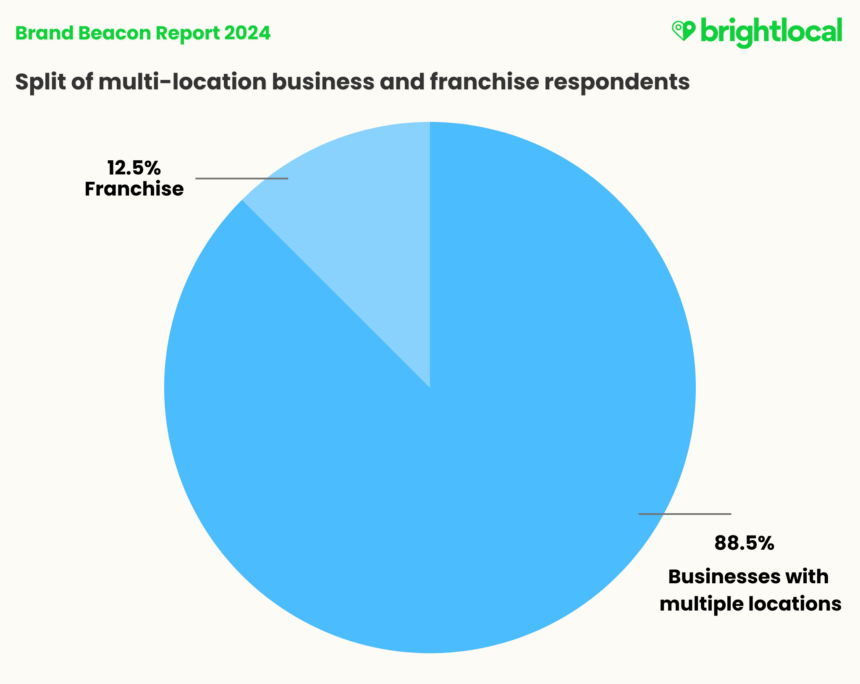
This research was conducted in partnership with Sapio Research, a B2B market research company, to survey a panel of 200 marketing decision-makers for multi-location and franchise businesses in the USA, the UK, and Canada. A comprehensive screening system was implemented to ensure only respondents fitting the criteria could participate.
Breakdowns of survey respondents by geographical location, industry, and business type can be found below.